LEAD-ALKALINE GLAZED EGYPTIAN FAIENCE: PRELIMINARY TECHNICAL INVESTIGATION OF PTOLEMAIC PERIOD FAIENCE VESSELS IN THE COLLECTION OF THE WALTERS ART GALLERYYUNHUI MAO
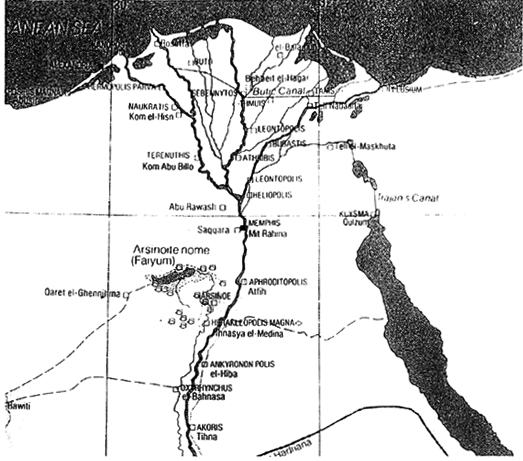
ABSTRACT—ABSTRACT—The manufacturing technique of pharaonic faience has been studied extensively in the past. However, stylistic and technological changes took place with Egyptian faience produced in the Ptolemaic Period (330 b.c.-30 b.c.). Very few faience samples of this period have been analyzed, and their methods of manufacture are not well known. The aim of this study was to characterize the materials and methods of manufacture of a group of low-relief and bicolored faience vessels in the Walters Art Gallery. A total of 21 vessels and vessel fragments were studied. A number of analytical techniques were employed: stereomicroscopy, xeroradiography, energy dispersive x-ray fluorescence spectroscopy, and scanning electron microscopy, including both wavelength and energy dispersive spectrometry. The research results aided in the identification of body types and glazes used during production and in the determination of the fabrication techniques employed. Significant was the discovery of the use of lead-alkaline glaze on a quartz faience body. The results suggest that Ptolemaic faience may have been the earliest known example of intentional lead-alkaline glaze used in antiquity. TITRE—La fa�ence �gyptienne avec gla�ure alcaline plombeuse: �tude technique pr�liminaire des r�cipients en fa�ence de l'�poque ptol�ma�que � la Walters Art Gallery (Galerie d'art Walters). R�SUM�—Les techniques de production de la fa�ence � l'�poque des pharaons ont d�j� �t� �tudi�es consid�rablement. Cependant des changements stylistiques et technologiques dans la fa�ence �gyptienne eurent lieu lors de l'�poque ptol�ma�que (entre 330 et 30 av. J.-C.). Tr�s peu d'�chantillons des fa�ences datant de cette �poque ont �t� analys�s et leurs m�thodes de production sont peu connues. Le but de cette �tude �tait de d�finir les mat�riaux et les m�thodes de production d'un groupe de r�cipients en fa�ence bicolores et avec moulures peu prononc�es, appartenant � la Walters Art Gallery. En tout, 21 r�cipients complets ou fragmentaires furent analys�s. Plusieurs techniques d'analyse furent utilis�es: la st�r�omicroscopie, la x�roradiographie, la spectrom�trie de fluorescence des rayons X � dispersion d'�nergie et la microscopie �lectronique � balayage, coupl�e � la spectroscopie des rayons X � dispersion, soit d'�nergie ou de longueurs d'onde. Les r�sultats obtenus contribu�rent � identifier les types de p�te et de gla�ure employ�s et aussi � d�terminer les m�thodes de fabrication utilis�es. La d�couverte d'une gla�ure alcaline plombeuse sur des p�tes � base de quartz fut particuli�rement int�ressante. Ces r�sultats sugg�rent que la fa�ence ptol�ma�que constitue le plus ancien exemple connu de l'utilisation d'une gla�ure alcaline plombeuse dans l'antiquit�. TITULO—Alfarer�a egipcia vidriada al plomo alcalino: investigacion t�cnica preliminar de vasijas del periodo ptolemaico de la colecci�n de la galeria de arte Walters. RESUMEN—La t�cnica de fabricaci�n de alfarer�a egipcia ha sido extensamente estudiada en el pasado. Sin embargo, cambios estil�sticos y tecnol�gicos se produjeron en la alfarer�a egipcia en el per�odo Ptolemaico (300 a.c.-30 a.c.). S�lo unas pocas muestras de alfarer�a de este per�odo han sido analizadas y sus m�todos de fabricaci�n no se conocen bien. El prop�sito de este estudio fue la caracterizaci�n de materiales y m�todos de manufactura de un grupo de bajo relieves y vasijas de alfarer�a bicrom�ticas de la Galer�a de Arte Walters. Se estudiaron un total de 21 vasijas y fragmentos de vasijas. Se emplearon una serie de t�cnicas anal�ticas: estereomicroscop�a, xeroradiograf�a, espectroscop�a de fluorescencia por dispersi�n de rayos x y microscop�a electr�nica de barrido, incluyendo espectroscop�a por dispersi�n de energ�a y de longitud de onda. Los resultados de la investigaci�n permitieron la identificaci�n de tipos de objeto y vidriados utilizados durante la producci�n, as� como la determinaci�n de las t�cnicas de fabricaci�n empleadas. Result� significativo el descubrimiento del uso del vidriado al plomo alcalino en un objeto de alfarer�a de cuarzo. Estos resultados sugieren que la alfarer�a Ptolemaica podr�a ser el ejemplo m�s antiguo que se conoce sobre el uso intencional de vidriado al plomo alcalino en la antig�edad. 1 1. INTRODUCTIONFaience objects were made in Egypt beginning in predynastic times. Faience objects commonly seen were vessels, beads, amulets, shabtis, inlays, plaques, rings, and small statues. Faience production reached its peak in the New Kingdom Period (1570 b.c.-1070 b.c.). The manufacturing technique of pharaonic faience has been established. In general, it is made of a quartz body with an alkaline glaze achieved by one of three glazing methods: application, self-glazing by efflorescence, or self-glazing by cementation (Vandiver 1982; Kaczmarczyk and Hedges 1983; Tite and Bimson 1986). Molding and inlaying were often used during the manufacturing. However, Egyptian faience underwent stylistic and technological changes during the Ptolemaic Period. The Ptolemaic Period dates from 330 b.c. to 30 b.c., when Egypt was ruled by a dynasty of Greek origin that coincides with the Greek Hellenistic Period. In the chronology of Egyptian history, it is also known as the first part of the Greco-Roman Period. Ptolemaic faience is known to have been produced in the Delta region of Lower Egypt (fig. 1). Various examples are known to come from Naucratis, Memphis (Petrie 1911), and recently Arthribis (Mysliwiec 1996; Spencer and Schofield 1997).
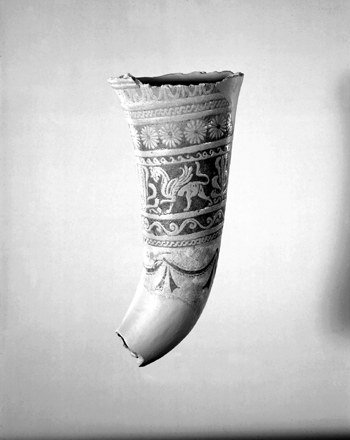
This study deals only with faience vessels. Little information has been published on the overall stylistic context of Ptolemaic faience vessels. Following examination of several Ptolemaic faience collections in Europe, Egypt, and the United States, the author has categorized these vessels into two stylistic groups: vessels with high relief and vessels with low relief. The surface of Ptolemaic faience vessels is generally decorated in monochrome glaze or two-toned glazes in contrasting colors. In some cases polychrome glaze is used, and in a few instances gilding is applied in localized areas. This study focuses only on a group of low-relief Ptolemaic faience vessels that have two contrasting glaze colors in the collection of the Walters Art Gallery. A total of 21 Ptolemaic faience vessels and vessel fragments in the Walters Art Gallery were studied. They are listed in table 1. Most of the pieces came from the collection of the Reverend William MacGregor (Johnston 1999, 211).1 All of the pieces date from about 300 b.c. to 200 b.c. (Reeder 1988; Scheurleer 1998). They are probably from the Delta region but have no record of specific provenance. Five of the 21 faience pieces in the group are complete vessels; their size varies, from the smallest jar (acc. no. 48.378, 10.3 x 3.3 cm) to the largest jar (acc. no. 48.365, 20.6 x 6.5 cm). The remainder of the pieces studied are vessel fragments. The distinguishing features of this group include refined shape, thin walls, two-toned glazes in contrasting colors, and detailed low-relief surface decorations arranged in friezes. A typical example is a rhyton (acc. no. 48.368) shown in figure 2. The low-relief design can be seen either on the exterior alone or on both interior and exterior. Similar decorative motifs are repeatedly used, such as rosettes, garlands, palmettos, ivy and berries, waves, scrolls, braids, griffins, and human figures (see table 1). The design can be seen either in relief or in recess, forming interplay of positive and negative images. Foreign influences are apparent in the construction and the decorative motifs of these pieces. The shape of the rhyton shown in figure 2 exhibits some influence of Near Eastern origin, as do other motifs including rosettes, palmettos, and griffins (Reeder 1988). Bands of human figures, animals, or birds are frequently presented in a Hellenistic style (Wallis 1897). The shades of green and blue used in Ptolemaic faience are distinct from the predominant turquoise blue color used in pharaonic faience.
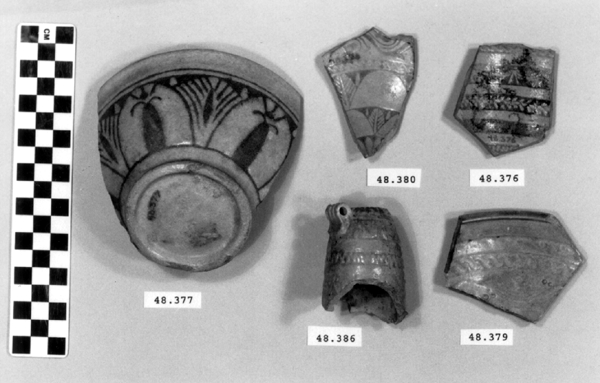
This type of Ptolemaic faience vessel has received little attention. Very few faience samples of this type have been analyzed (Kaczmarczyk and Hedges 1983, app. C; Friedman 1998, 265), and their methods of manufacture have not yet been studied completely (Scheurleer 1986; Nenna and Seif el-Din 1993). The aim of this study was to characterize the materials and methods of manufacture of a group of this type of faience vessel by means of visual inspection and analytical techniques. 2 2. METHODOLOGYThe technical investigation involved three stages: stereomicroscopy, nondestructive analytical techniques including xeroradiography and energy dispersive x-ray fluorescence (ED-XRF), and finally scanning electron microscopy with both wavelength dispersive spectrometry (SEM-WDS) and energy dispersive spectrometry (SEM-EDS). Visual examination was undertaken with a binocular optical microscope (10–40x). The cross sections of Ptolemaic faience at broken edges were examined, and a layered structure—body, an underglaze, and a glaze—was defined. Xeroradiography, a nondestructive analytical technique, was used to investigate the construction method of Ptolemaic faience.2 Xeroradiography is capable of detecting minor differences in the radiodensity of solid objects. It has particular application in examining ceramics, as it produces images of greater contrast than conventional x-ray radiography. Joints, seams, air bubbles, inclusions, and the orientation of the ceramic body can be easily identified, all of which are not usually visible in conventional x-ray radiography. Another nondestructive analytical technique, qualitative ED-XRF analysis, was chosen for initial determination of the elemental composition of the surface of the glaze as well as that of the underglaze.3 The goal was to group the 21 pieces by similarity in the glaze and the underglaze constituents in order to select a group of representative pieces for sampling for scanning electron microscopy. Since ED-XRF provides only surface analyses, it is possible that the x-rays may not penetrate through the glaze layer to reach the underglaze. Therefore, the selected sites for the underglaze analyses included areas where the glaze was worn or chipped away, exposing the underglaze. The purpose of ED-XRF analyses of the underglaze was to check whether there were additional elements, not found in the glaze. Based on the ED-XRF results and stylistic diagnoses, five fragments were selected (acc. nos. 48.376, 48.377, 48.379, 48.380, and 48.386) for SEM analyses to represent the group of 21 pieces (fig. 3). The decorative motifs of these five pieces are commonly seen in Ptolemaic faience. They can be linked to low-relief and bicolored Ptolemaic faience in other collections for future comparison. The range of glaze colors, in terms of variation in shades of blue and green, was also a consideration in choosing the samples.
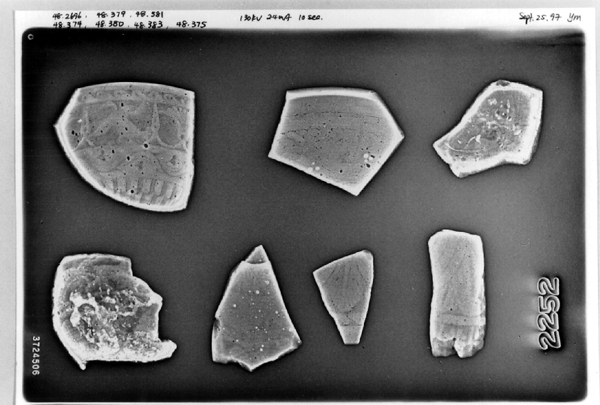
The primary analytical method employed to characterize major and minor constituents in the glaze, the underglaze, and the body was scanning electron microscopy. Polished sections of the samples were made to include the bodies, the underglaze layers, and the glaze layers.4 Some samples included only the exterior surface, and some included both interior and exterior surfaces. The description of each sample is reported in table 2. Scanning electron microscopy-wavelength dispersive spectrometry (SEM-WDS) was undertaken for quantitative analyses of the glaze and the underglaze. WDS was chosen for its accuracy and precision in analyses. Its high resolution minimizes the potential for any overlap of analytical x-ray lines in the study of ancient glassy materials including glazes (Verita et al. 1994). Three spots were selected at random for repetition of the WDS analysis in each of the glaze and the underglaze layers. The averages and standard deviations (1-sigma) of the variability of the three analyses are reported in table 3. All WDS results were reported in the actual range of oxide-weight percentages and have not been normalized. Scanning electron microscopy-energy dispersive spectrometry (SEM-EDS) was undertaken for semiquantitative analysis of the overall body composition. EDS allows the analysis of a large area, which is important in heterogeneous samples (fig. 3). Only one site per sample was analyzed. In all cases, a maximum body area of a sample was analyzed, up to several square millimeters. All EDS results were normalized and are reported in the actual range of oxide-weight percentages in table 4. They were obtained from the average value of the area analyzed. The operating conditions used for EDS and WDS analyses are described in the appendix.
3 3. RESULTS AND DISCUSSION3.1 3.1 STEREOMICROSCOPYBroken edges of vessel fragments and vessels with minor breakage and losses were examined under the microscope. All pieces exhibit a layered structure, which is composed of a body, an underglaze, and a glaze layer. The body appears to be white or pale yellow (see table 2) and is very fine textured. In some cases the body contains small, bubblelike holes in the broken edges, indicating trapped air bubbles. The underglaze is present only at localized recessed areas to reveal surface designs. It appears to be thick and is opaque. The underglaze was probably applied as a layer of slurry overall, then wiped off from raised areas, leaving it collected in the recesses. It would be very time-consuming to fill each individual recess of a complex and detailed surface design. The glaze is present overall on both the interior and the exterior. It appears to be thin and transparent. Drip marks are observed in the interior of some of the vessel fragments and vessels, indicating that the overall glaze is applied. The glaze is weathered and exhibits a fine network of cracks. It is abraded and worn, particularly in the raised areas. The underglaze and the glaze can be easily distinguished visually by the contrasting color hues used (see table 2). In general, the underglaze is greenish blue to blue, and the glaze is pale yellow to light green. The underglaze has a stronger and darker color than the glaze, thus emphasizing the design (see figs. 2, 3). The underglaze is also thicker than the glaze (see table 2). In addition to its usual colors, yellow is used as an accent for the underglaze in two cases (acc. nos. 48.367 and 48.379). The yellow underglaze is present only on the raised dot decorations. The examination of a half-broken dot indicated that the raised dots were probably created in the mold rather than applied after molding. The dots have the same body material underneath the yellow underglaze. 3.2 3.2 XERORADIOGRAPHYXeroradiography contributed to the understanding of the forming and the construction process. All pieces appear to be made from a mold or from piece molds. Neither circular lines associated with wheel-turning nor specific orientation of any particles was observed. The interiors of enclosed vessels, such as jars, are not as smooth as the exteriors, thus further suggesting the pressing of an object against a mold. In many cases, the xeroradiograph revealed numerous round or oval-shaped holes in the bodies. The holes are probably associated with air bubbles produced during the kneading of the body material. The trapped air bubbles (up to 2 x 3 mm) in the body indicated that the body was not very plastic and was hard to manipulate (fig. 4).
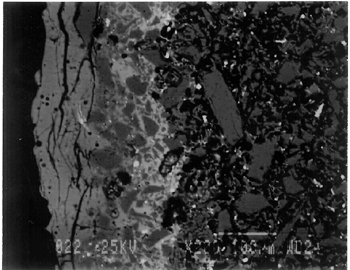
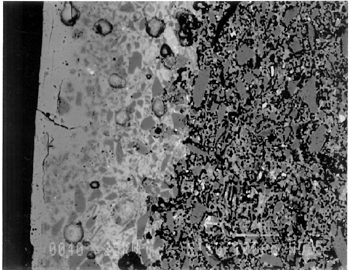
Joints were observed in the xeroradiograph, which confirmed that piece molds were used for making objects with complex shapes or large size. The rhyton (see fig. 2), tall jars with narrow openings, and bowls with both interior and exterior relief decorations are examples of the use of piece molds. After the piece was taken out of the mold, the final details and designs were enhanced through carving and/or incisions. 3.3 3.3 ENERGY DISPERSIVE X-RAY FLUORESCENCE (ED-XRF)In most of the pieces analyzed, lead, copper, iron, calcium, and antimony were detected qualitatively by ED-XRF in the surfaces of both the glaze and the underglaze. However, a tile, acc. no. 48.1664, was alkaline glazed. Being an exception, it was excluded from the study. All the remaining 20 pieces consistently exhibited an intense lead peak in the ED-XRF spectra. This finding led to questions about the faience glaze: Was the glaze a pure lead-silica glaze or an alkaline glaze containing lead? For the eventual selection of fragments for further analyses, the 20 pieces were divided into two groups based on the varied amounts of copper and iron present in the glaze and the underglaze layer. In one group of 14, the glaze layer contained more copper than the underglaze; in the other group of 6, the glaze layer contained more iron than the underglaze. 3.4 3.4 SCANNING ELECTRON MICROSCOPY (SEM)3.4.1 3.4.1 ExaminationBased on the ED-XRF results and stylistic diagnosis, five representative pieces (acc. nos. 48.376, 48.377, 48.379, 48.380, and 48.386) were selected (see fig. 3) for in-depth SEM analysis, with one additional sample taken from a raised dot area of a bowl (acc. no. 48.367) to determine the yellow colorant. All polished sections of the samples were examined under the reflected light of a polarized microscope (100x). The thickness of the glaze layer, the underglaze layer, and the body were defined. Munsell soil color and Munsell color charts were used for determining the colors of each layer. The lighting conditions used for all color readings were to simulate daylight generated by a lamp, which combined both incandescent and fluorescent bulbs. The color choices of green, blue-green, and yellow in glazes were highly fashionable in the Ptolemaic period, as opposed to the predominantly turquoise blue used previously. 3.4.2 3.4.2 SEM-WDS ResultsThe analyses of the glaze layer were carried out in an area where glaze alone is present or in the glassy areas, to avoid the underglaze. For example, the glaze analysis of acc. no. 48.379 was carried out on the exterior where only glaze is present (fig. 5), and the glaze analysis of acc. no. 48.380 was done in the glassy matrix of the glaze layer (fig. 6). Obvious cracks and voids were also avoided when selecting analytical sites; however, the presence of extensive microcracking throughout the weathered surface of the glaze layer meant that ideal areas for glaze analysis do not exist. The analyses of the underglaze layer were carried out in the glassy matrix visible on the back-scattered electron images (figs. 6–7) as a white dense band away from the glaze layer. SEM-WDS analyses (in oxide wt%) of the glaze layer reveal that the major oxide in the glaze is silica (SiO2), ranging from 68% to 78%. A considerable amount of lead was identified in the glaze layer, with lead oxide (PbO) ranging from 2.4% to 11.1%. The alkali content, combining sodium oxide (Na2O) and potassium oxide (K2O), is below 1%. The chloride content is somewhat high, ranging from 1.2% to 2.5%, a finding that often suggests the glaze surface has been weathered (Freestone 1998).
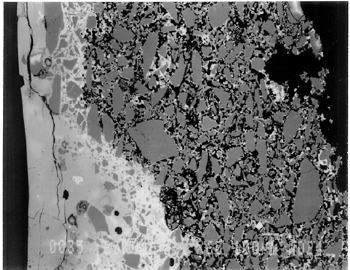
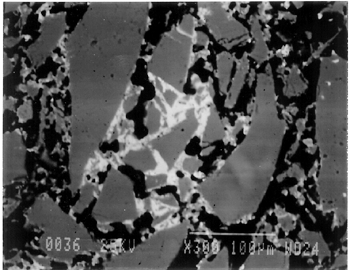
The solubility of chlorine in the alkaline glaze depends upon the amount of sodium present in the glaze. At about 15% Na2O, the solubility of chlorine is about 1.3%, which is about the maximum amount of chlorine that is found in unweathered alkaline glazes and glasses (Barber and Freestone 1990). When the surface of the glaze is weathered away, some of its components still remain, and chlorine content could actually be increased (Freestone et al. 1985). Also, the weathered areas of the glaze can easily absorb chloride salts in the groundwater during burial, thus increasing chloride content when analyzed. Sometimes the chloride in the weathered glaze can be identified as copper chloride inclusions or other more complex salts (Freestone 1998). In this study, the weathered glaze surface is also confirmed by the microscopic examination through a fine network of cracks and heavy abrasion on the glaze surface. As a result, the glaze has been depleted in alkali, leaving a lead-enriched surface. SEM-WDS analyses of the underglaze layer indicate that its composition is similar to that of the glaze but different in alkali content. The underglaze is relatively less weathered than the glaze layer. The alkali content is significantly increased, with Na2O and K2O ranging from 4.7% to 11.9%, and the chloride content between 0.3% to 1.3%, much lower than that of the glaze layer. The percent totals in the glaze layers are low, ranging from 84.4% to 93.2%. This finding is probably due to a topography problem of the weathered glaze layers, which exhibit many voids and microcracks (Freestone 1982). The surface is so weathered overall that, even with a small beam size of 10 x 10 μm, it is impossible to avoid them during analysis. Also, the samples were polished using Micro-meshes up to 6,000 grit. This polishing regime may not have been fine enough, thus contributing to the low totals (Gabriel 1985). Similar elements were found in both the glaze and the underglaze in the SEM-WDS analyses. The difference between them appears to be limited to the concentrations of colorants present. As a result, two distinctively colored glaze layers were produced. The analytical data are supported and confirmed by visual examination. Copper, iron, cobalt, antimony, and manganese were likely used as colorants to achieve a range of green and blue colors. In general, the concentration of antimony is greater in the glaze layer (0.03–0.3%) than that of the underglaze layer (below detection limit to 0.03%), with a varied amount of copper, producing pale yellow to light green on the overall glaze layer. The concentrations of iron and cobalt are much greater in the underglaze, producing blue in the underglaze. The concentration of manganese varies from sample to sample. The glaze analyses of acc. nos. 48.377 and 48.379 were carried out where only a glaze layer is present. The cobalt concentration of the glaze (0.1–0.2%) is much less than that of the underglaze layer (0.5–1.0%). In contrast, the concentrations of cobalt detected in the glaze of acc. nos. 48.376, 48.380, and 48.386 are similar to those found in the underglazes. Since both layers of glazes penetrated simultaneously into the body upon firing, interdiffusion of colorants between the glaze and the underglaze is likely to have occurred. Therefore, the cobalt concentrations in the glaze layers of these three samples are not reliable. Observed cobalt concentration differs from added cobalt concentration. The concentration of cobalt detected in the underglaze (0.8–1.5%) is much higher than the amount detected in faience of earlier periods, up to 0.5% (Shortland and Tite 1998). To evaluate the accuracy of the cobalt analyses, a glass standard, 734XH, with 1.11% of cobalt oxide, was obtained from Corning Incorporated to analyze the cobalt concentration in the underglaze again. The cobalt compositions determined with the new standard were within the ranges found previously in table 3. The high concentration of cobalt in the underglaze can be explained by its preparation. To reveal the surface design through a colored glaze layer, the underglaze has to be darker. The underglaze may have been prepared as a “raw pigment,” quite concentrated in cobalt, to “paint the design” on the surface. A parallel example was found in a Roman Period faience bowl reported colored by about 1% cobalt oxide (CoO) (Kaczmarczyk and Hedges 1983, 53). Future analyses of more samples of Ptolemaic faience are needed to support the high concentration of cobalt observed in the underglaze. SEM-WDS analysis on the yellow raised dot suggests that lead antimonate (Pb2Sb2O7) was most likely to have been used as the yellow colorant. The amount of antimony oxide (Sb2O5) detected in the yellow area was 0.7%, a large amount indicating its deliberate use with lead as a yellow colorant, as opposed to being used as a decolorant of less than 0.2% of Sb2O5 (Kaczmarczyk and Hedges 1983, 98–101). 3.4.3 3.4.3 SEM-EDS ResultsSEM-EDS results, given in table 4, indicated that the bodies of all samples consist chiefly of quartz (SiO2), ranging from 88–94%. A small amount of the glazing material, containing lead, sodium, and potassium, appears to be deliberately mixed with the siliceous body, presumably to improve the fusion of the body components during firing. The quantitative composition of the interstitial glaze material has not been analyzed. Trace amounts of alumina were also detected within a range of 0.4–1.7%. The small amount of alumina present does not appear to have been added to increase the plasticity of the body but is a by-product of other constituents. It could come from the glazing material. In some cases, lead antimonate particles were suggested by SEM-EDS. The small amount of lead antimonate and iron oxide that are present in the quartz body contribute the yellowish appearance of the body. The amount of antimony present is less than 0.7%, not significant enough to affect the fusion of body components. As seen in back-scattered electron images (figs. 5–8), the body is heterogeneous. The majority of the gray areas are crystalline quartz, about 20–100 μm in size. Their extreme fineness enabled the transfer of the sharp design from the mold. The quartz body is mixed with interstitial glaze material seen in white spots (see fig. 8) to produce fusion of quartz grains during firing.
The thickness of each layer is reported in table 2, and a distinguishable boundary between the glaze and the underglaze was established on the back-scattered electron images. The lead-alkali glaze appears to have penetrated into the quartz body during firing. This finding is evident in the slightly dense glaze-body interaction layer, which appears as a white band in the back-scattered electron image (see fig. 5). The glaze layer area appears less dense as surface weathering leached out alkalis. The weathering is also seen as cracks and pitting. The glaze layer appears homogeneous in all three back-scattered electron images (see figs. 5–7). The penetration of lead-alkali glaze into a ceramic substrate is not unique to Ptolemaic faience; it has been noted in Iznik tiles (Kingery and Vandiver 1986, 129). It is important to note that the invasion of the glaze into the body (see fig. 5) due to the low viscosity of molten lead-alkali glaze should not be confused with the efflorescence glazed process of alkali glaze. Judging from the back-scattered electron images of the efflorescence process of alkali glaze (Tite and Bimson 1986), the efflorescence of pharaonic faience and the application process of lead-alkali glaze of Ptolemaic faience have a similar appearance. They both have a glaze-body interaction layer. However, the different glaze ingredient distinguishes them. The underglaze appears to be dense, seen as a white band, since it is not as weathered and contains more alkali (see figs. 6, 7). Since both the glaze and the underglaze have similar chemical compositions, interdiffusion of the two layers is likely. The underglaze appears to be a slurry mixture of glaze material and quartz particles. The quartz particles in the underglaze appear to be finer than that in the body. 3.4.4 3.4.4. Firing TemperatureAccording to the literature (Kingery and Vandiver 1986), ancient quartz-paste ware was predominantly made in a one-fire process. Theoretically, lead-alkaline glaze would provide a lower melting temperature than that of alkaline glaze. Within limits, the higher the lead content is, the lower its melting temperature would be (Nordyke 1984). This finding makes it possible that Ptolemaic faience may have been fired at a lower temperature than that of pharaonic faience. 4 4. CONCLUSIONSThe study of Ptolemaic faience vessels has yielded some exciting results. Analyses revealed that lead-alkali glaze was used on a chiefly quartz body in this particular group of Ptolemaic faience vessels, a composition very different from the alkali glaze typically used for pharaonic faience vessels. Although lead in glaze existed in earlier Egyptian faience (Vandiver 1983, specimens 183–115–774, 183–115–775, and 186–68–336), it occurred in isolated instances and was associated primarily with yellow colorant as a component of lead antimonate. In contrast, the lead appears to be used as a modification of glaze in the Ptolemaic period, when it may have been deliberately added to the alkali glaze to improve the glaze properties. Lead in a lead-alkali glaze can reduce the viscosity of the glaze during firing. It also enhances the optical brilliance of the glaze (Kingery and Vandiver 1986). In addition, the results of this study suggest that Ptolemaic faience might have been the earliest known example of the use of lead-alkali glaze in antiquity. Lead (or lead oxide) had been used as a constituent in glass formulations for more than 3,000 years (Nordyke 1984). However, the first use of lead glaze in the West seems to have occurred during the Roman era, 100 b.c. to 100 a.d. (Tite et al. 1998). In the Near East, it was not used until about 200 b.c.; the Syrians and Babylonians first learned to use lead glaze for pottery (Rhodes 1973). A related group of glazes is known as tin-opacified glazes containing both lead and alkali. They were first produced in Iraq. A small amount of lead (1.0–2.6%) in alkaline glaze was first reported in early Islamic turquoise-glaze wares from Iraq, dated to about 700 a.d. (Mason and Tite 1997). There is no controversy about the dating of the Ptolemaic faience pieces at the Walters Art Gallery used for this study; the dates of their manufacture range from about 300 b.c. to 200 b.c. Their dates make them the earliest known examples of lead-alkali glaze reported so far. Increased sophistication is evident not only in the development of the glaze but also in the manipulation of the glazes and the body. The bicolored surface was achieved by the application of two layers of glaze. Both the underglaze and the glaze were applied instead of self-glazed. The underglaze was applied overall first as a fine slurry mixture on the exterior, then was wiped away from the raised areas. The overall glaze was then applied on both the exterior and the interior. The body was made of finely ground quartz mixed with glaze material for good fusion. Copper and lead antimony were used in small amounts as colorants for green in the glaze. Cobalt (dominant), iron, and probably manganese in small amounts were used as colorants for blue in the underglaze. Lead antimonate was used as a colorant for yellow. The shape of the vessel and the relief surface were produced by the use of a mold, or piece molds, with additional enhancement through carving and/or incision. Visually, changes took place in the aesthetic appearances of the Ptolemaic faience vessels as compared to earlier examples. Foreign motifs were incorporated in the design. A light green glaze color became fashionable instead of the previously predominant turquoise blue color. Relief designs were presented in contrasting glaze colors, instead of monochrome or separate inlay colors often seen in earlier faience vessels. Although fine and delicate faience vessels existed in the earlier periods, visual distinctions can be made when comparing the Ptolemaic vessels with the earlier ones. The molded low relief on the Ptolemaic faience vessels appears to be shallower than the low relief in the earlier faience vessels; the shapes of the Ptolemaic faience vessels are complex and somewhat exotic, such as the rhyton (see fig. 2). The techniques of molding the quartz body, creating low relief designs, and the glaze application continued from the established tradition of Egyptian faience technology (Kaczmarczyk and Hedges 1983; Nicholson 1998). Yet, in other respects, Ptolemaic faience techniques incorporate change and innovation. The new developments may be the result of a natural progression built upon the traditional technology but may also come from influences outside Egypt. Little technical information is available about faience making in Egypt and elsewhere during the Ptolemaic period (Nicholson 1993, 39–41). In the case of the vessels studied, lead-alkaline glaze was deliberately used as an alternative to the predominant alkaline glaze. As faience technology progressed, the Egyptians themselves may have discovered the use of lead-alkaline glaze, either accidentally or by design; certainly, lead had previously been used for other purposes in Egyptian faience technology. Alternatively, the use of lead-alkaline glaze could have been linked to a transfer of technology from a neighboring culture beyond Egyptian borders. It is evident that foreign motifs and shapes were used in Ptolemaic faience production, revealing the mixture of cultures present in Egypt during that time. It is possible that this glaze modification was introduced by a foreign source and incorporated into Egyptian faience technology as an import. This study is focused mainly on the interpretation of technical observations and scientific data from a particular group of Ptolemaic faience vessels. It paves the way for the understanding of how the Ptolemaic faience production fits into the history of Egyptain faience technology and for future study of this fascinating and technologically innovative method of faience production. More study is needed to place Ptolemaic faience production within a broader context, including trade occurring at the time as well as its relationships to the contemporary ceramics and glass industry in the surrounding regions. It is hoped that this study will serve as an impetus for such research. ACKNOWLEDGEMENTSThis project was conducted during a two-year Andrew W. Mellon Foundation Fellowship, from 1996 through 1998, in the Objects Conservation Laboratory at the Walters Art Gallery. The author is grateful to the Mellon Foundation for making this research possible. The results of this study were first presented at the Washington Conservation Guild (WCG) meeting on February 5, 1998. I would like to thank Dr. Pamela Vandiver of Museum Support Center of Smithsonian Institution, who heard the presentation and offered her insights. The paper was later presented at the 31st International Symposium on Archaeometry in Budapest, Hungary, on April 30, 1998. I am grateful to Dr. Mike Tite of the Research Laboratory for Archaeology and the History of Art in Oxford for his interest and thoughtful comments. The author is indebted to Dr. Philip M. Piccoli of the Department of Geology, University of Maryland, for carrying out the SEM analyses, which were a major contribution to this study. The permission to use energy dispersive x-ray fluorescence at the Department of Conservation and Scientific Research at the Freer Gallery of Art, Smithsonian Institution, is gratefully acknowledged. Special thanks are owed to Dr. Steve Harvey of the Institute of Egyptian Art and Archaeology at the University of Memphis for his enthusiasm and curatorial assistance in the initial stage of this project, to Dr. Robert Mason of the Royal Ontario Museum West Asian Department, to Dr. Ian Freestone of the British Museum Department of Scientific Research, to Ms. Patricia Griffin of the Cleveland Museum of Art, and to Dr. Stephen Tong of Corning Incorporated and Dr. Robert Brill of Corning Museum of Glass, New York, for sharing their expertise and for providing specific information and references. Many thanks to scholars who provided access to their collections and valuable information: Dr. Helen Whitehouse, Ashmolean Museum, Oxford; Dr. R. A. Lunsingh Scheurleer, Allard Pierson Museum, Amsterdam; and Ms. Carol Andrews and Dr. A. Jeffrey Spencer, British Museum. The encouragement, support, and guidance of the Objects Conservation staff at the Walters Art Gallery are greatly appreciated. APPENDIXAPPENDIXContributed by Dr. Philip M. Piccoli, Assistant Research Scientist, Department of Geology, University of Maryland, College Park, Md. 20742 Samples were analyzed using a JEOL 840A Electron Probe Microanalyzer (scanning electron microscope with analytical capabilities) at the Center for Microanalysis, University of Maryland. Samples were coated with approximately 300 angstroms of carbon using thermal evaporation techniques prior to analysis. For both EDS and WDS, an accelerating voltage of 15 kv was utilized. Samples were observed using secondary electron (SEI) and back-scattered electron imaging (BEI). BEI can be used to evaluate the relative mean atomic number of grains within a given sample (the higher the mean atomic number, the lighter the grain when viewed using BEI). Regions on some specimens thought to be representative of the sample as a whole were photographed using SEI and/or BEI techniques. 1 1. CONDITIONS EMPLOYED FOR EDS ANALYSESAll EDS data were collected using a standard Be-window EDS detector (Noran) connected to a Tracor Northern 5500 II analyzer. The beam size (analytical area) for EDS analyses was as large as the sample would allow. Data were collected over the energy range of 0–10 kv. A sample current of approximately 1.5 nA (corresponding to an EDS detector dead time of 20–40%) and a count time of 60 seconds were utilized to collect raw intensities. Raw data (count rates) were corrected using an SQ algorithm using top-hat filters to correct for fluctuations in sample current and accelerating voltage. Raw intensities were converted to concentrations using the PRZ correction procedure. The SQ algorithm forces analytical totals to 100%. All data were collected at a working distance of 30 mm. Reconnaissance analyses of the body revealed that sodium (Na), silicon (Si), lead (Pb), chlorine (Cl), potassium (K), calcium (Ca), iron (Fe), copper (Cu), aluminum (Al), magnesium (Mg), and antimony (Sb) were the only elements present in significant quantity to be detected readily by EDS; in addition manganese (Mn) and titanium (Ti) were also explicitly sought in the analyses. Theoretical, stored peaks for all 13 elements were fitted to the acquired spectra to ensure all peaks were accounted for; all chi-square values are of the order of 2 or below, a finding that suggests all major peaks were accounted for. The technique is limited because: (1) elements lighter than Na (such as oxygen [O] and carbon [C]) cannot be detected, (2) water (and hydroxyl) present as an essential structural constituent cannot be detected, and (3) no indication of crystalline or amorphous material can be obtained. 2 2. CONDITIONS EMPLOYED FOR WDS ANALYSESBritish Glass Industry Research Association (BGIRA) standard 3 (for Na, Al, Pb, Sn, and Fe), Corning Museum of Glass standard A (for Si, K, Sb, Ca, Mn, and Cu), Meionite Scapolite (for Cl), in addition to cobalt (Co) and arsenic (As) metals were used as standards. Unknowns and standards were analyzed using a sample current of 40nA, a 10 x 10 μm rastered beam, an accelerating voltage of 15 kv, and count times of up to 30 seconds (reduced when counting statistics were better than 0.5%). Peak and background measurements were made on all standards and unknowns. K(alpha)-lines were analyzed for most elements; however, M-lines (Pb) and L-lines (Sn, Sb, and barium [Ba]) were also used. A rigorous WDS protocol was used in order to avoid complex overlaps of Pb and Sn with alkalis and to allow for lower detection limits. Using this protocol, the minimum detection limit (1 sigma) for elements determined by WDS were calculated and are reported in table 3. Data were collected using the software package pcTASK (Geller MicroAnalytical); raw intensities were converted to concentrations using the PRZ correction procedure. In most cases, analytical uncertainty presented in table 3 is considerably less than sample variability (compositional), revealing that samples are heterogeneous. In order to minimize any possible effect of migration of alkalis in the samples, alkalis (Na and K) were analyzed first, a large beam was used, and the beam was rastered. REFERENCESBaines, J., and J.Malek. 1980. Atlas of ancient Egypt. Oxford: Phaidon. Barber, D. J., and I. C.Freestone. 1990. An investigation of the origin of the color of the Lycurgus cup by analytical transmission electron microscopy. Archaeometry32:33–45. Freestone, I. C.1982. Applications and potential of electron probe micro-analysis in technological and provenance investigations of ancient ceramics. Archaeometry24:99–116. Freestone, I. C.1998. Personal communication. Department of Scientific Research, British Museum, London. Freestone, I. C., N. D.Meeks, and A. P.Middleton. 1985. Retention of phosphate in buried ceramics: An electron microbeam approach. Archaeometry27:161–77. Friedman, F. D, ed. 1998. Gifts of the Nile: Ancient Egyptian faience. New York: Thames and Hudson. Gabriel, B.1985. SEM: A user's manual for materials science. Metals Park, Ohio: American Society for Metals. Johnston, W.1999. William and Henry Walters, the reticent collectors. Baltimore: Johns Hopkins University Press. Kaczmarczyk, A., and R. E. M.Hedges. 1983. Ancient Egyptian faience: An analytical survey of Egyptian faience from predynastic to Roman times. Warminster, England: Aris & Phillips. Kingery, W. D., and P. B.Vandiver. 1986. Ceramic masterpieces. New York: Free Press. Mason, R. B., and M. S.Tite. 1997. The beginnings of tin-opacification of pottery glazes. Archaeometry39:41–58. Mysliwiec, K.1996. In the Ptolemaic workshops of Athribis. Egyptian Archaeology9:34–36. Nenna, M.-D., and M.Seif el-Din. 1993. La vaisselle en fa�ence du Mus�e Gr�co-Romain D'Alexandrie. Bulletin de Correspondance Hell�nique, II �tudes chroniques et rapports (�cole Fran�aise D'ath�nes)117:565–603. Nicholson, P.1993. Egyptian faience and glass. Princes Risborough, England: Shire Publication Ltd. Nicholson, P.1998. Materials and technology. In Gifts of the Nile: Ancient Egyptian faience, ed. F. D.Friedman. New York: Thames and Hudson. 50–64. Nordyke, J. S.1984. Lead in the world of ceramics. Columbus, Ohio: American Ceramic Society. Petrie, W. M. F.1911. The pottery kilns at Memphis. In E. B.Knobel, W. W.Midgeley, J. G.Milne, M. A.Murray, and W. M. F.Petrie, Historical studies II. London: School of Archaeology in Egypt. 34–37. Reeder, E.1988. Hellenistic art in the Walters Art Gallery. Princeton, N.J.: Princeton University Press. 105–6. Rhodes, D.1973. Clay and glazes for the potter. Radnor, Pa.: Chilton Book Company. Scheurleer, R.1986. Thirteen drinking cups. In Enthousiasmos: Essays on Greek and related pottery, ed. H. A. G.Brijder, A. A.Drukker, and C. W.Neeft. Amsterdam: Allard Pierson Museum. 147–56. Scheurleer, R.1998. Personal communication. Allard Pierson Museum, Amsterdam. Shortland, A. J., and M. S.Tite. 1998. The interdependence of glass and vitreous faience production at Amarna. Ceramics and Civilization8:251–65. Spencer, A. J., and L.Schofield. 1997. Faience in the ancient Mediterranean world. In Pottery in the making: World ceramic traditions, ed. I.Freestone and D.Gaimster. London: British Museum Press. 104–9. Tite, M. S., and M.Bimson. 1986. Faience: An investigation of the microstructures associated with the different methods of glazing. Archaeometry28:69–78. Tite, M. S., I.Freestone, R.Mason, J.Molera, M.Vendrell-Saz, and N.Wood. 1998. Review article: Lead glazes in antiquity—methods of production and reasons for use. Archaeometry40:241–60. Vandiver, P. B.1982. Technological changes in Egyptian faience. In Archaeological ceramics, ed. J. S.Olin and A. D.Franklin. Washington, D.C.: Smithsonian Institution Press. 167–79. Vandiver, P. B.1983. Appendix A: The manufacture of faience. In A.Kaczmarczyk and R. E. M.Hedges, Ancient Egyptian faience: An analytical survey of Egyptian faience from predynastic to Roman times. Warminster, England: Aris & Phillips. A1–A144. Verita, M., R.Basso, M. T.Wypyski, and R. J.Koestler. 1994. X-ray microanalysis of ancient glassy materials: A comparative study of wavelength dispersive and energy dispersive techniques. Archaeometry36:241–51. Wallis, H.1897. Egyptian ceramic art: The MacGregor collection. London: Taylor and Francis. 81–85. AUTHOR INFORMATIONYUNHUI MAO received her B.A. in chemistry and studio art from Bowdoin College in 1991 and her M.S. in art conservation science, majoring in objects conservation, from the University of Delaware in 1996. She has completed a graduate internship at the Freer Gallery of Art, Smithsonian Institution, and a two-year postgraduate Mellon Fellowship at the Walters Art Gallery, Baltimore. Currently, she is a visiting objects conservator at the Walters Art Gallery. Address: Walters Art Gallery, 600 N. Charles St., Baltimore, Md. 21201 Received for review April 14, 1999. Revised manuscript received November 2, 1999. Accepted for publication February 15, 2000. NOTES1.. MacGregor was a well-known collector of Egyptian antiquities during the 19th century. His collection was sold at Sotheby's in London in 1922. Henry Walters purchased his pieces from a Paris- and New York-based art dealer, Dikran Kelekian, in 1923, a year after the London sale. 2.. Xeroradiography was carried out at the Division of Conservation and Technical Research at the Walters Art Gallery, using the Xerox 126 system for xeroradiography. Xeroradiographs were taken at 150kv, 2.4 mA, and 10 seconds. 3.. Energy dispersive x-ray fluorescence analysis was undertaken using Omega-5, a modified Spectrace 6000, at the Department of Conservation and Scientific Research at the Freer Gallery of Art, Smithsonian Institution. Data were collected at 40 kv, 0.99 mA, and 100 seconds. 4.. Each sample area was first cleaned with ethanol to remove surface dirt. The sample was removed using a jeweler's saw and then was impregnated in a polyester resin. The sample was polished using sandpapers first, followed by various grades of Micro-mesh, up to 6,000. Micro-mesh is made of silicon carbide, thus eliminating the possibility of introducing aluminum as a contaminant to the faience body. The polishing residue trapped in the voids was removed by immersing the sample in an ultrasonic tank containing distilled water for approximately 2–5 seconds, depending on the needs of each sample.
 Section Index Section Index |
|||||||||||||||||||||||||||||||||||||||||||||||||||||||||||||||||||||||||||||||||||||||||||||||||||||||||||||||||||||||||||||||||||||||||||||||||||||||||||||||||||||||||||||||||||||||||||||||||||||||||||||||||||||||||||||||||||||||||||||||||||||||||||||||||||||||||||||||||||||||||||||||||||||||||||||||||||||||||||||||||||||||||||||||||||||||||||||||||||||||||||||||||||||||||||||||||||||||||||||||||||||||||||||||||||||||||||||||||||||||||||||||||||||||||||||||||||||||||||||||||||||||||||||||||||||||||||||||||||||