THE ROLE OF CLAYS IN THE DECAY OF ANCIENT EGYPTIAN LIMESTONE SCULPTURESCARLOS RODRIGUEZ-NAVARRO, ERIC HANSEN, EDUARDO SEBASTIAN, & WILLIAM S. GINELL
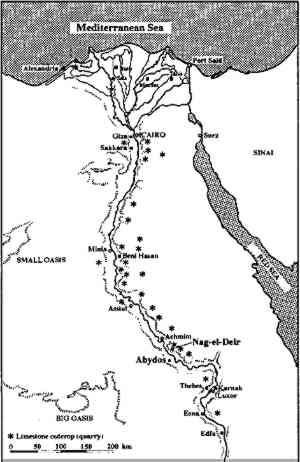
3 RESULTSThe Egyptian limestones studied belong to the upper member of the early Eocene Thebes formation
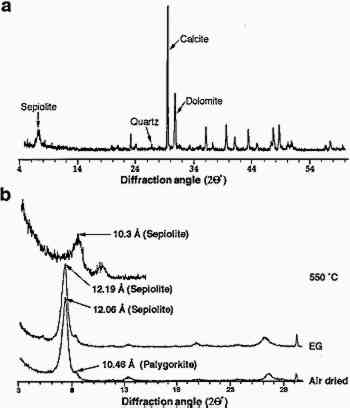
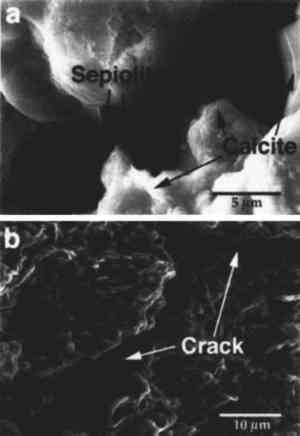
Chemical analyses were carried out to determine the salt content of the limestone. Table 1 shows the result of the ICPMS analysis for major cations as well as the result of the IC analysis for the major anions. MgO and SiO2 are present at levels consistent with magnesium-rich, clay-bearing limestone. These data also reflect the presence of dolomite together with the clays. The soluble salt content of the limestone is <1% and consists mainly of chlorides and nitrates. TABLE 1. EGYPTIAN LIMESTONE SCULPTURE (NAGA EL-DEIR STELA) CHEMICAL COMPOSITION (WEIGHT PERCENT) Powder XRD analyses of the bulk samples (fig. 3a) showed that calcite was the major phase (70%), with dolomite (<20%), clay minerals (<10%), and quartz (<5%) as minor phases. Mineral contents were calculated from XRD data. Due to the error of this technique (�5%), concentration of minor phases (clay and quartz) was also evaluated by weighing the acid-insoluble residue, which for the Naga el-Deir limestone was 15% by weight. Separation of the clay minerals (particle size <20 μm, the silt and clay fraction) from the quartz (particle size >20 μm, the sand fraction) was performed by centrifugation. The clay plus silt fraction was 10% of the original sample weight and the sand fraction 5%.
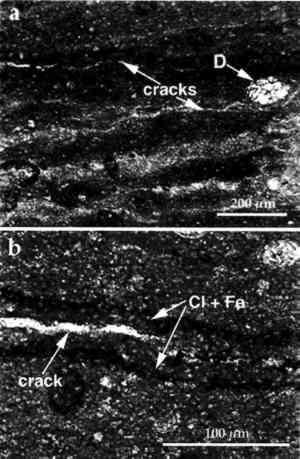
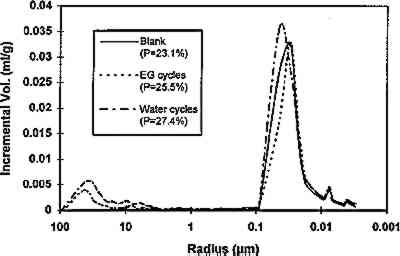
The fraction with particle size <2 μm was separated by centrifugation, as mentioned earlier, and an XRD analysis of the oriented clay aggregates was performed. Fig. 3b shows the diffractograms of oriented clay aggregates. An Partial immersion in distilled water resulted in the complete disintegration of the immersed part of the stone. Above the water surface, salt efflorescence growth was detected. Whiskerlike halite (NaCl) crystals were deposited above the capillary fringe, but no damage was observed in this area. A minor amount of soda niter (NaNO3) also was detected. XRD analysis of the efflorescence confirmed the presence of halite (major salt) and soda niter (minor proportions). From IC chemical analysis data, the total salt content was found to be ∼ 1% by weight. Nevertheless, no damage was detected where salt growth took place. After three ethylene glycol cycles, all samples suffered complete disintegration by fracture parallel to the bedding planes. The same type of damage was also achieved by wetting/drying cycles using distilled water. After immersion in distilled water, samples were thoroughly fractured along bedding planes. In many cases no second run was possible since total destruction of the samples was achieved in only one cycle. Extensive damage was also apparent after completion of a four-week relative humidity cycling test in an environmental chamber. Spalling and delamination of superficial scales (with thickness up to 4 mm) took place following RH cycling. An average weight loss of up to 7.17% was achieved after 84 cycles. No efflorescence Sample porosities were found to be 23.1%, 25.4%, and 27.3% for the control, the sample after EG, and the sample after water immersion (wetting/drying) cycles, respectively. It was concluded that macroporosity changes were due to damage created by cyclic expansion and contraction of the clays, which affected the internal microstructure of the stone, as shown by the change in pore size distribution (fig. 4). These changes were also detected by SEM observation and were evidenced by the formation of large fractures parallel to the bedding planes (fig. 5).
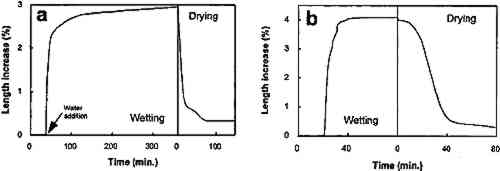
The results of the thermomechanical analysis are shown in figure 6. When immersed in distilled water (30�C) for less than 1 hour, the stone swelled about 3% in the direction perpendicular to the bedding planes. After the first wetting/drying cycle was completed, a 0.3% permanent mechanical deformation was noted. A second wetting/drying cycle produced a faster and greater expansion of the sample (up to 4%), which can be interpreted to mean that the structural damage created in the first wetting/ drying cycle enhances the damage produced in the following ones.
|