AIR-COUPLED ULTRASONIC SYSTEM: A NEW TECHNOLOGY FOR DETECTING FLAWS IN PAINTINGS ON WOODEN PANELSALISON MURRAY, MARION F. MECKLENBURG, C. M. FORTUNKO, & ROBERT E. GREEN
4 RESULTS4.1 SIMULATED PANEL PAINTINGS
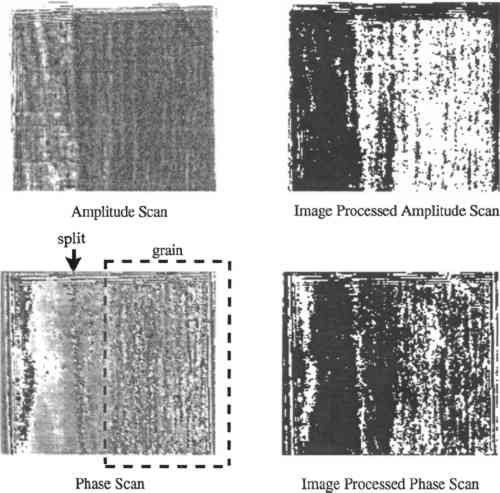
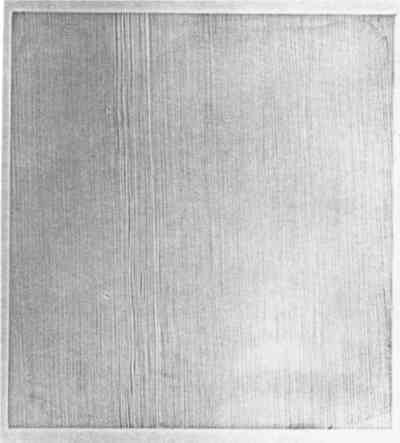
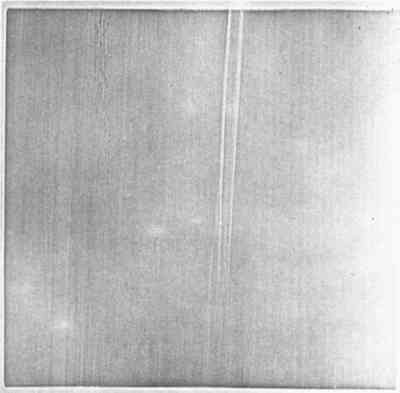
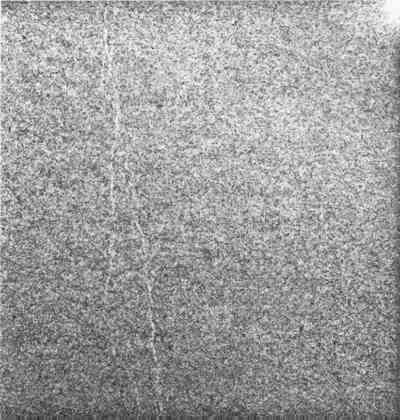
Figure 4a shows the ultrasonic results from sample 1, the oak support with a split and a
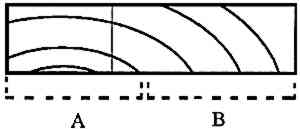
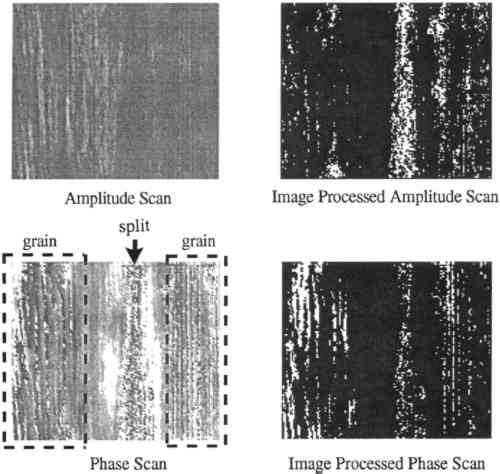
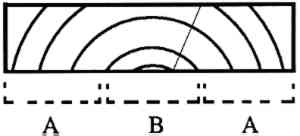
The grain is visible only in certain locations: for example, in section B in figure 4, but not in section A. When the transducers scanned the area marked A, the signal easily passed through the material in a radial direction without being skewed by the grain; however, in section B, the ultrasonic signal was skewed by the grain and the grain was thereby imaged. For both the oak and the poplar panels, all types of scans (amplitude, phase, processed amplitude, and processed phase) indicate the presence of splits; however, the phase scans resolve them most clearly. The amplitude measurements merely show a change on either side of the split, as in the case of the oak, or do not resolve the split as well, as in the case of the poplar. The fact that the system is not always able to distinguish splits from grain can be compensated for by using it in conjunction with other techniques. Air-coupled ultrasound ensures that attention is drawn to the flawed area and that the extent of the flaw is known. The most useful application of this technique would be to detect flaws when they are still subsurface. The xeroradiographs of both panels are shown in figures 6 and 7. The broad split in the poplar panel (sample 2) is better illustrated
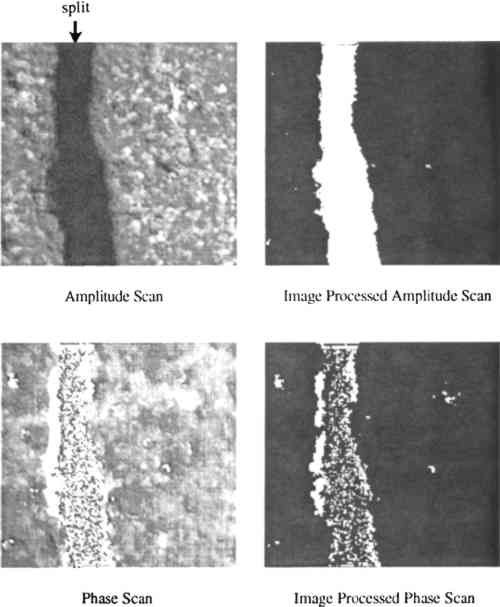
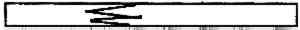
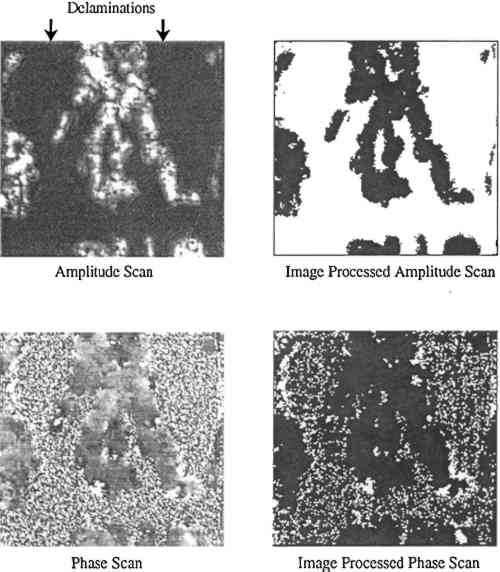
The results from the hardboard differ substantially from those for the previous woods because of the material properties of hardboard. The mottled appearance of the ultrasonic scan of sample 3 (fig. 8a) is characteristic of hardboard tested in these experiments. Because of the lamellar structure, delaminations rather than a split are formed. The delaminations are clearly visible as a vertical stripe along the left-hand side of the sample. The amplitude scans are most easily read, as the phase scans show the delaminated areas with a speckled pattern. Figure 8b shows the cross section of the panel.
The samples were examined with xeroradiography and infrared thermography to enable comparison with the ultrasound technique. As expected, the xeroradiograph shown in figure 9 did reveal a line where the board was bent, but not the areas associated with the delaminations. Infrared thermography experiments, which are not shown, did not delineate the flaws clearly.
A scan made of sample 4, which has cleavage between the hardboard support and the gesso, is shown in figure 10. Both the amplitude and the phase scans unambiguously detect cleavage; however, as with sample 3, the amplitude information is easier to read because the phase scans contain a speckle pattern. The scan shows that there is cleavage but does not determine the exact depth from the surface.
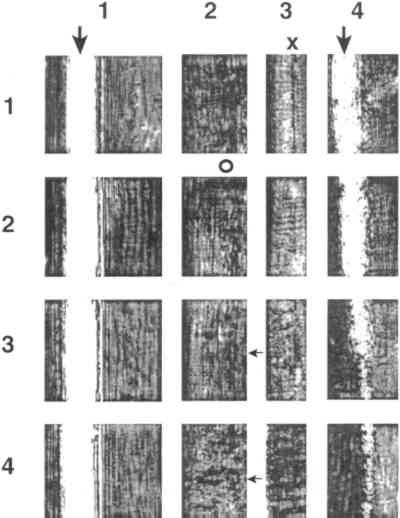
In the unprocessed amplitude scan, various gray levels show the different degrees of cleavage. Complete cleavage results in a total loss of signal, illustrated by black. Cleavage with partial contact allows some of the ultrasonic signal to pass through and is shown by a gray between the two extremes of white and black. The ultrasound results confirm the visual examination that shows cleavage at the edges of sample 4. Information from ultrasound is invaluable in cases of blind cleavage, as in this example where neither xeroradiography nor infrared thermography, which are not shown here, detected the cleavage. 4.2 PAINTINGSInvestigations of the cradled painting show the type of information that can be obtained with air-coupled ultrasound. The cradle was not well adhered, and wherever the cradle was not in contact with the panel the signal was interrupted by an air gap. The ultrasonic scans could, therefore, be performed only in the 16 areas between the cradle members. Figure 11 shows the unprocessed amplitude results from these 16 areas. The unprocessed amplitude scans provided the best results, rather than the phase scans, which were best for samples 1 and 2; the panel in this case was radially cut, as is typical of northern oak panels, rather than tangentially cut.
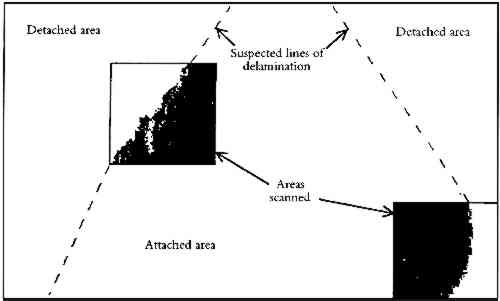
The check lies between the third and the fourth battens and can be seen in the ultrasonic image at the X in figure 11. The surrounding area has grain structure, which does not show in the ultrasound results. With xeroradiography there is little evidence of the check (fig. 12). The open splits appear as white lines (indicated by large arrows in fig. 11) and are larger on the ultrasonic image than in reality because of diffraction effects. These effects could mask other, fine-scale flaws. Other features are of interest in the ultrasonic scan results in figure 11. The lines in the two areas located in the second column and first and second rows, adjacent to the circle, could indicate either grain or splits, though their regular spacings imply grain. The horizontal lines in the two areas in columns two and three and rows three and four, as shown by the arrows, are the craquelure in the paint layer running perpendicular to the grain. Knots can also be seen in the first column, first row. Figure 13 shows the outline of the painting on the illustration board mounted on hardboard and the results from ultrasonic imaging of two areas investigated within the painting. The processed amplitude scans clearly show the delaminations as white areas. The dotted lines show the places at which it is suspected that the paperboard has become delaminated; time did not allow the entire painting to be scanned. As expected, xeroradiography results, which are not shown, do not show any delaminations.
|