FIBER-SAFE EXTRACTION OF RED MORDANT DYES FROM HAIR FIBERSERICA J. TIEDEMANN, & YIQI YANG
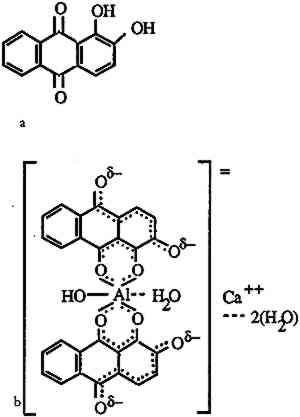
ABSTRACT—To extract red mordant dyes from wool fiber samples, a new method was devised using a solution of 0.1% ethylene diamine tetraacetic acid in water combined with N,N-dimethyl formamide. This method, which was tested on madder, Relbunium, and cochineal dyestuffs having an alum mordant, enabled the authors to analyze the extracted dyes with spectrophotometry for their characteristic absorption curves and also left the fibers sufficiently intact for use in further examinations. The new method is compared with previous dye extraction methods. A case study of its application on samples of pre-Columbian cameloid fibers is presented. 1 INTRODUCTIONNot long ago, historic dyestuff analysis was accomplished by comparing the visible hues of an unknown dyeing against known dyeings and basing conclusions on the best color match. Because of color changes due to fading or aging and variations in the natural sources of the dyes, the constitution of the dyebath, and the fiber substrates, this method is not reliable. Hence researchers have sought more discriminating methods related to the chemical composition of the dyes. These include a systematic series of extractions and chemical reactions (Schweppe 1988), ultraviolet/visible light spectrophotometry (UV/VIS) (Young 1957; Saltzman et al. 1963; Saltzman 1978, 1986, 1992), infrared (IR) spectrometry (Abrahams and Edelstein 1964; Hofenk-de Graaff 1969; Martoglio et al. 1990), thin layer chromatography (TLC) (Geiss-Mooney and Needles 1981; Kharbade and Agrawal 1985; Schweppe 1986, 1988), and high-performance liquid chromatography (HPLC) (Wouters 1985; Wouters and Verhecken 1985, 1989a, 1989b; Walker and Needles 1986; Fischer et al. 1990; Wouters and Rosario-Chirinos 1992). Apart from the single fiber IR method proposed by Martoglio et al. (1990), all these procedures require extraction of the dye from the fiber. Until now, researchers have extracted dyes in strong acid solutions. With heat, the hydrochloric or sulfuric acid solutions quickly release the dyes from the fibers. At the same time, the acid also quickly destroys protein and cellulosic fibers as well as some of the dyes. Because of the need to balance the level of destruction with the amount of information obtained when examining historic textile materials, emphasis has been placed on reducing the size of specimens. The extraction method described below, using ethylene diamine tetraacetic acid (EDTA) and N,N-dimethyl formamide (DMF), extracts sufficient dye from 2 mg specimens for spectral detection and identification yet leaves wool fibers intact for further investigation. The effectiveness of the method is compared with the water/methanol/hydrochloric acid (HCl) extraction method developed by Wouters and Verhecken (1989b). Concentrations of the yarn extracts are measured with the photometry function on the UV-VIS spectrophotometer. Also, the absorbance curves for madder, Relbunium, and cochineal after EDTA/DMF extraction are shown to be readily distinguishable for identification purposes. The effect of the EDTA/DMF treatment on wool fibers is The EDTA/DMF extraction method is also tested on red fibers taken from the collection of ancient Peruvian textiles in the Krannert Art Museum, University of Illinois, Champaign. The dyes are identified by UV/vis spectrometry. Microscopic examination reveals that the fibers remain in good condition after extraction. 2 THE MORDANT-DYE COMPLEXThe natural red dyes used in this study are madder, Relbunium, and cochineal. Madder, a vegetable dye produced by Rubia tinctorum common to Europe and the Middle East, contains mainly alizarin as well as purpurin, pseudopurpurin, munjistin, and rubiadin (Wouters 1985). Relbunium, from the species Relbunium ciliatum, Relbunium hirsutum, Relbunium hypocarpium, is a related vegetable dye native to South America. Schweppe (1986) identified purpurin and pseudopurpurin as components of Relbunium dye, emphasizing that it contains no alizarin. Wouters and Rosario-Chirinos (1992) also identified xanthopurpurin and munjistin in the extract of a Relbunium dyeing. Cochineal, an insect dye produced by the species Dactylopius coccus, also originates from South and Central America. Its main component, carminic acid, is accompanied by flavokermesic acid, kermesic acid, and four unknown components (Wouters and Verhecken 1989a, 1989b). All the above dyes are anthraquinone derivatives. These and the components of other natural dyes are characterized in Thompson's comprehensive work on natural coloring matters (1971). Excepting flavorkermesic acid, which has been characterized more recently (Wouters and Verhecken 1987), Wouters has conveniently provided all of the structures on one page (Wouters 1985). Because anthraquinone dyes have only moderate affinity for protein fibers, their fastness was often enhanced by mordants. Mordants, which are metal salts that form an insoluble complex with dye molecules, include potassium aluminum sulfate (alum), copper sulfate, potassium dichromate, and ferrous sulfate. The nature of the mordant-dye complex was clarified in a series of articles on the metal complexes of alizarin (Kiel and Heertjes 1963a, 1963b). Figure 1 shows the structure of the calcium-aluminum lake of alizarin adapted from Kiel and Heertjes. The alizarin molecules are capable of forming six-member chelate rings with aluminum ions. Colored lakes formed by the metal ions and dye molecules resist extraction by water and organic solvents, which readily strip similarly structured acid dyes. The sheer size of the complex may account for some of its insolubility. It is also
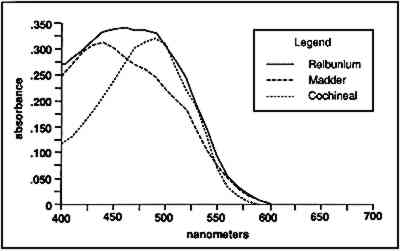
The conventional extraction method, using strong acid, probably functions by replacing hydrogen ions for the metal ion, thus releasing the metal ion from the complex. Single dye molecules should then be free to go into solution. With their slight acidic character, however, these particular dyes should not be soluble in strongly acidic solution. By destroying the fiber, then, the acid liberates dye molecules despite their poor solubility. It has been shown that some of the dye molecules are also unstable at such low pH. Although carminic acid, alizarin, rubiadin, and purpurin are stable in 3 N hydrochloric acid solution in a boiling water bath, pseudopurpurin and munjistin decarboxylate to purpurin and xanthopurpurin even without heating (Wouters 1985). The proposed extraction method uses EDTA to break up the mordant-dye complex. Like the dye molecules, EDTA complexes with the metal ion. EDTA, however, will react with metal ions in a 1:1 ratio because it supplies six pairs of electrons (West and Sykes 1958). Because it is a stronger chelating agent than the hydroxylated anthraquinone dyes, EDTA complexes preferentially with the metal ion. With the metal ions masked by the EDTA, dye molecules are free to go into solution. During preliminary testing, however, it was quickly discovered that EDTA alone in water would not extract the dye. A mixture of methanol and water was the next option because methanol has been used consistently in the acid extractions and to dissolve dried samples of the dyes. This mixture, too, gave unsatisfactory results. DMF, a polar aprotic solvent often used to extract acid dyes, mixed in a 1:1 ratio with the EDTA solution did extract the dye. Clearly, the dyes are soluble in water because that is the solvent used for extraction from the natural source as well as for dyeing. As mentioned above, they are also soluble in methanol. Nevertheless, despite the binding of the mordant to EDTA, the dyes will not move appreciably from the fiber into water alone. As demonstrated by the successful dyeing, the dyes have affinity for the fiber in water. Although polar interactions are important to the solubility of the dye in water as well as the attraction between dye and fiber, hydrophobic interaction is the main force involved in the dye's affinity for the fiber. The dye's large aromatic system is responsible for this kind of attraction. Due to hydrophobic interaction, the dye-fiber attraction is greater than the dye-water attraction despite the dye's solubility in water. With the help of EDTA, the dye's solubility increases in water/DMF (1/1 v/v) because the dye-DMF attraction is greater than the dye-fiber attraction. It should be noted that EDTA solubility decreases drastically in the water/DMF solution. A concentration of 0.1% EDTA was effective for the dye extractions and precluded precipitation. Altogether, the organic acid and the solvent should have little effect on protein fibers (Trottman 1975). 3 EXPERIMENTAL3.1 MORDANTING AND DYEINGApart from the solution concentrations and number of rinses, all wet-processing procedures followed the recipe that appears in table 1. Fabric for dyeing was Testfabrics wool gabardine fabric (worsted) no. 522. Specimens were cut with an area of 20 cm2 and dried weight ranging from 0.40 g to 0.45 g. Prior to mordanting, all specimens were boiled for a half an hour and rinsed three times in deionized water. TABLE 1 MORDANTING AND DYEING CONDITIONS The experiments were designed using an alum mordant because, of the mordants used in textile dyeing, aluminum has the lowest stability constant for complexes with EDTA (West and Sykes 1958). Therefore if the method is effective for aluminum-dye complexes, it should An alum mordant solution of alum 5.62 g/L and cream of tartar 1.87 g/L was made based on conversions from a dyeing manual (Adrosko 1971). After mordanting, the wool was not rinsed. Excess liquor was squeezed out of the wool, and it was allowed to dry. For dyeing, the dry, mordanted wool was placed directly into the dye liquor. Madder roots were cut into small pieces and soaked overnight in deionized water before Soxhlet extraction in water. The extract was then vacuum-filtered. Twenty g of extract were oven-dried for 4 hours at 50�C and then 2 hours at 100–105�C. The remaining solids were weighed to find the concentration of coloring matter, which was .04 g dye/g extract. (For the sake of convenience, the dried contents of the root and insect extracts will be referred to as “dye,” although it was quite clear that these contained impurities. Despite the inaccuracy, some frame of reference was needed for determining solution concentrations.) Dyebath concentration was 16g dye/L. Cochineal insects were crushed with a mortar and pestle and extracted with water in a Soxhlet. After vacuum filtering, 10 g extract were dried and weighed as above, giving a concentration of .05 g dye/g extract. Dyebath concentration was 2 g dye/L based on the dried weight of the extract. After dyeing, the fabrics were rinsed three times in deionized water and allowed to air-dry. 3.2 YARN EXTRACTIONFor a comparison of extraction concentrations, 5 cm long specimens were raveled from known dyeings of madder and cochineal. In preparation for extraction, the yarns were dried for 2 hours at 105�C and weighed to the nearest 0.1 mg. Twenty dried specimens from each dyeing were selected for tests of extraction concentration—10 tests of the HCl extraction and 10 tests of the EDTA-DMF extraction. The strong acid extraction was carried out according to the procedure used by Wouters in an extraction solution of water/methanol/37% HCl (1/1/2 v/v/v). Two mg dyed yarn were placed in a test tube with 1 ml HCl extracting solution. The test tube was placed in a boiling water bath for 10 minutes and then cooled rapidly in a cold water bath. The EDTA extraction solution consisted of 0.1% EDTA in water/DMF (1/1 v/v). Two mg yarn were extracted with 1 ml EDTA solution in a test tube for 30 minutes in a boiling water bath and then cooled rapidly in a cold water bath. Before extraction, fibers from the Peruvian yarns were examined under a microscope. One mg or less of yarn was extracted in 0.5 ml of the EDTA/DMF solution as above. For safety reasons, all extractions were carried out in a fume hood. 3.3 SPECTROPHOTOMETRYSpectrophotometry is most accurate at a wavelength of peak absorption. Because the chemicals studied here are colored compounds, they will have absorption maxima within the range of visible light. They also give strong, sharp peaks in the ultraviolet region for benzenoid and quinoid absorption. Although a sharp peak is ideal for measuring concentrations To make calibration curves of peak concentrations, a 50 ml extraction was run for both madder root extract and cochineal insect extract in each solution. Due to the scarcity of Relbunium root and Relbunium-dyed fabric and yarn, we were unable to run a comparison of extraction concentrations for it. The ratios for the HCl- and EDTA-extracting solutions were the same as those used in the yarn extractions. These extractions also followed the same extraction times as above. The cochineal insect extract solutions contained 0.025 g dye and 0.012 g alum. Alum content for the cochineal solutions was estimated based on the molar ratio of 1:2 (aluminum:carminic acid), assuming that all the dye was carminic acid. Such calculations were not possible for the madder root extract solutions because the root extract clearly contained more than just dye. Because of its comparatively low color strength in solution as well as on the dyed fibers, it was assumed that the madder solution would require less alum. Thus the madder solutions contained 0.10 g dye and 0.0096 g alum. As detailed in section 3.2, 10 2-mg yarn extractions were run for each dye in both extracting media. After heating, known solutions as well as yarn extractions were corrected by weight for evaporation. The contents of each flask and test tube were restored to their original masses with methanol for the HCl extraction and with deionized water for the EDTA/DMF extraction. All tests were run on a Hitachi U-2000 Spectrophotometer. To obtain the absorbance curves shown in figure 2, madder-, Relbunium-, and cochineal-dyed yarns were extracted in EDTA/DMF solution as above. The madder and cochineal yarn extracts were diluted with deionized water to show the curves at similar absorbance levels.
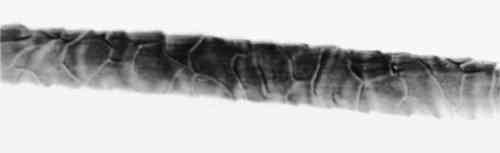
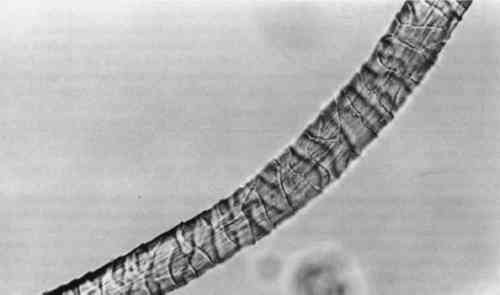
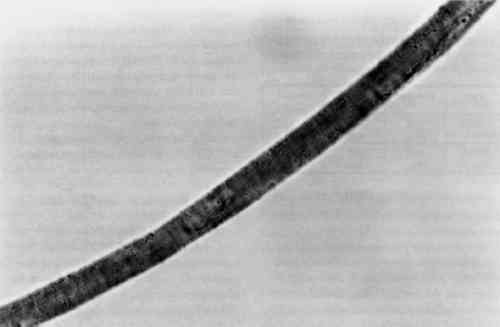
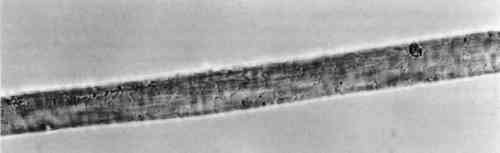
3.4 TENSILE STRENGTHFor the tensile strength tests, 20 warp and 20 filling yarns were selected randomly from the cochineal-dyed fabric. Yarn length was 5 cm. Ten yarns from each direction were reserved as the control sample. Ten yarns from each direction were extracted in EDTA/DMF solution as described above in two batches, warp and fill, with 0.5 ml solvent to each mg yarn. After extraction, yarns were rinsed three times in deionized water and dried at ambient temperature. A single fiber was selected from each yarn for testing, giving sample totals of 10 warp fibers and 10 filling fibers. Linear density was estimated for each fiber assuming cylindrical cross section from three diameter measurements according to ASTM D 2130-90 appendix (ASTM 1992a). Tensile testing was carried out according to ASTM D 3822-91 (ASTM 1992b). Due to mechanical failures, we were unable to condition the fibers to specifications. After diameter measurement, fibers were secured to tabs and “rested” for 24 hours. Tests were completed in one sitting at 72�F and 77% RH. 4 RESULTS AND DISCUSSION4.1 EXTRACTIONAlthough some yarn solids were recoverable from the HCl extractions, they were not readily recognizable as fiber material. On the other hand, using the EDTA/DMF extraction method, it was not possible to strip the yarns to their original color. Repeating the extraction yielded no more dye. Although visually, under fluorescent light, the initial color strength of the dyed madder yarns was as intense as the dyed cochineal yarns, after extraction the madder yarns were more heavily stained even when dry. Relbunium dyed yarns 4.2 SPECTROPHOTOMETRYFigure 2 shows the visible spectra of madder, Relbunium, and cochineal as extracted from wool yarn in 0.1% EDTA in water/DMF, pH 6.0. Despite incomplete extraction from the yarns, the three curves are readily distinguishable as in previous studies. Madder has a peak at 437.5 nm, Relbunium at 455.5 nm, and cochineal at 493.0 nm. The concentrations of the yarn extractions appear in table 2 along with peak absorbance (λ-max) and the correlation coefficient for the calibration curve (r2). Because we were interested in the colored compounds in the solution, we used the peak in the visible region of the spectrum for our estimation of dye concentration. Although it was clear that a large part of the solids, referred to as dye, were not dyes, especially in the madder root extract, the calibration gave nearly the same absorbance curves as the yarn extracts. Despite the impurities, these extractions were deemed acceptable references. Dye concentrations, as they appear in table 2 as g dye/g fiber, reflect the presence of other water-soluble substances in the root and insect extracts. TABLE 2 RESULTS OF DYED YARN EXTRACTIONS The concentrations of the fiber extracts did not compare entirely as expected. Although it left the yarn heavily stained, the EDTA extraction of madder-dyed yarn yielded more dye than the HCl extraction. Some explanation for The concentrations of the cochineal yarn extractions differed less than the concentrations of the madder yarn extractions. The HCl extraction yielded slightly more than the EDTA/DMF extraction at 0.13 g dye/g fiber compared to 0.11 g dye/g fiber. Unlike pseudopurpurin and munjistin, carminic acid, the main component of cochineal, has been shown to be very stable in 3 N HCl. Under these circumstances, where the HCl extraction is at its best—breaking up the mordant-dye complex and releasing dye from the fiber without also damaging the dye—it can be said that the EDTA/DMF performs comparably. 4.3 VARIATIONS IN ABSORPTION CURVESIn general, the peak absorption for the dyes is not always the same. Shifts in pH caused by new batches of chemicals can cause shifts in absorption curves. Given the expense of chemical waste disposal, workers may wish to recycle their DMF by distillation. If so, it is important to note that absorption curves for the dyes can vary greatly among fresh and recycled batches of chemicals. For example, in the absorption curve shown in figure 2, the peak absorption for cochineal is 493.0 nm, whereas the peak absorption found for EDTA/DMF extracted cochineal in the concentration tests for both the calibration solution and yarn extracts was 526.5 nm. The only difference between these tests was the DMF in the extraction solutions: the first was fresh DMF and the second was recycled DMF. According to the DMF label, there are 0.0004% titratable acids in the solvent. After recycling this DMF will have a higher pH than at the outset because it will have been purified of any mineral acids in the original batch. The EDTA solution with fresh DMF had a pH of 6.0, and the solution with recycled DMF had a pH of 6.5. As pH increased, the dyes showed a bathochromic shift. Hence workers should be wary that absorption maxima may vary even within their own laboratories. 4.4 FIBER SURFACE STRUCTUREFibers for micrographs were mounted in deionized water and observed under an Olympus BH2-RFCA light microscope. Figures 3 and 4 show two fibers from the same piece of cochineal-dyed cloth. The fiber in figure 3 is before extraction, and the fiber in figure 4 has been extracted by the EDTA extraction method. The extraction has not destroyed the characteristic wool surface structure. Hence the fiber may still be used for other analysis or mounted permanently for future reference.
Although the wool yarn was not completely dissolved after HCl extraction, it was no longer retrievable as fiber. Instead, there were small fragments of fiber floating in the solution, and 4.5 TENSILE STRENGTHThe results of the single fiber tensile strength tests appear in table 3. Tenacity is given in g force/denier, and the standard deviation for each group of tests is given in the far right column. These results are expected to indicate effects that the treatment might have on the molecular structure of the fiber. Clearly, the EDTA extracted fibers show some loss of tensile strength. After processing at 100�C for 30 minutes, some deterioration is to be expected. Nevertheless, the fibers had good retention of tenacity considering that the alternative is destruction. TABLE 3 RESULTS OF SINGLE FIBER TENSILE STRENGTH TESTS 4.6 PERUVIAN YARN EXTRACTIONSThe sources of red yarns taken from the Krannert Art Museum collection of Peruvian textiles include the red fringe of a border fragment All of the yarns were quite brittle. Under the microscope, most fibers had visible scales and discontinuous medullas. Surface structure on the South Coast Wari headband fibers was The extraction proceeded for these fibers much as it did in the wool tests. Fresh DMF was used. After 30 minutes in the boiling water bath, the dye had been released into solution and the fibers remained pink and intact. Before measuring the absorbance of the Peruvian yarn extracts, the 0.5 ml solutions were diluted with 1 ml deionized water. Absorbance curves of the extracted dyes all matched the cochineal reference curve. EDTA/DMF extraction left the microscopic surface structure of the fibers unchanged and in some instances slightly improved. Figures 5 and 6 show fibers from the Paracas Necropolis border fragment before and after extraction. Although the surface scales are evident in these micrographs, the best assessment of the fiber surface is accomplished on the microscope by shifting the plane of focus through the fiber.
Altogether, the EDTA/DMF extraction of the ancient Peruvian red yarns was successful and nondestructive. 5 CONCLUSIONSIt has been shown that madder, Relbunium and cochineal on an alum mordant can be extracted by a solution of 0.1% EDTA in water/DMF (1/1 v/v). Although the extracted fibers retain some color, the EDTA/DMF extraction method can be as powerful as the conventional strong acid extraction. Consequently, fiber specimens need not be larger than 2 mg for spectral detection. Like the strong acid extracts, the EDTA/DMF extracts give a specific absorbance curve for each dye. Thus the new extraction method is compatible with UV/VIS spectrophotometry, an established dye identification method. Unlike the strong acid extraction, the EDTA/DMF extraction is effective without destroying protein fibers. Because the dye is safely extracted without dissolving the substrate, the fibers remain useful for other research. The usefulness of this method has not yet been tested for TLC or HPLC analysis. Perhaps chromatographic separation of the fiber extracts will reveal which dyes remain on the fiber after extraction. It is assumed that there will be little or no amino acid noise in HPLC because the fiber does not break down during extraction. ACKNOWLEDGEMENTSWe gratefully acknowledge the assistance of Max Saltzman, who generously provided samples of Relbunium-dyed yarn for this study. We appreciate the cooperation of Maarten van de Guchte and the Krannert Art Museum. Also, we would like to thank Shiqi Li for his assistance in the laboratory. This research was funded by the University of Illinois Agricultural Experiment Station (Hatch 60-370 SHRFS). SOURCES OF MATERIALSWool used in the cochineal and madder dyeingsTestfabrics Wool Gabardine (worsted) no. 522, Testfabrics, Inc., Middlesex, N.J. Unprocessed madder roots and dried cochineal insectsEarth Guild, Asheville, N.C. Relbunium-dyed wool yarnMax Saltzman, Los Angeles, Calif. Mallinckrodt, Inc., St. Louis, Mo. Cream of tartar leveling agentStrawberry Fields, Urbana, Ill. Disodium EDTA, biotechnology gradeAmresco, Inc., Cleveland, Ohio Reagent grade N,N-dimethyl formamide and spectral grade methanolFischer Chemical, Fair Lawn, N.J. REFERENCESAbrahams, D. H., and S. M., Edelstein. 1964. A new method for the analysis of ancient dyed textiles. American Dyestuff Reporter53:19–25. Adrosko, R. J.1971. Natural dyes and dyeing. New York: Dover Publications. ASTM 1992a. Standard test method for diameter of wool and other animal fibers by microprojection, D 2130–90. In Annual book of ASTM standards, vol. 7:01, Textiles. Philadelphia: American Society for Testing and Materials. ASTM 1992b. Standard test method for tensile properties of single textile fibers, D 3822-91. In Annual book of ASTM standards, vol. 7:02, Textiles. Philadelphia: American Society for Testing and Materials. Fischer, Ch.-H., M., Bischof, and J. G., Rabe. 1990. Identification of natural and early synthetic textile dyes with HPLC and UV/VIS-spectroscopy by diode array detection. Journal of Liquid Chromatography13:319–31. Geiss-Mooney, M. E., and H. L., Needles. 1981. Dye analysis of a group of Late Intermediate Period textiles from Ica, Peru. In Preservation of paper and textiles of historic and artistic value II, ed.J. C.Williams. Advances in Chemistry series 193. Washington, D.C.: American Chemical Society. 291–300. Hofenk-de Graaff, J. H.1969. Natural dyestuffs: Origin, chemical constitution, identification. In ICOM Committee for Conservation Preprints, 2d Plenary Meeting, Amsterdam. Paris: ICOM. 69/16. Kharbade, B. V., and O. P., Agrawal. 1985. Identification of natural red dyes in old Indian textiles: Evaluation of thin-layer chromatographic systems. Journal of Chromatography347:447–54. Kiel, E. G., and P. M., Heertjes. 1963a. Metal complexes of alizarin: Part 1, The structure of the calcium-aluminium lake of alizarin. Journal of the Society of Dyers and Colourists79:21–27. Kiel, E. G., and P. M., Heertjes. 1963b. Metal complexes of alizarin. Part 2, The structure of some metal complexes of alizarin other than turkey red. Journal of the Society of Dyers and Colourists79:61–64. Martoglio, P. A., S. P., Bouffard, A. J., Sommer, J. E., Katon,, and K. A., Jakes. 1990. Unlocking the secrets of the past: The analysis of archaeological textiles and dyes. Analytical Chemistry62:1123A–28A. Saltzman, M.1978. The identification of dyes in archaeological and ethnographic textiles. In Archaeological chemistry II, ed.G. F.Carter. Advances in Chemistry series 171. Washington, D.C.: American Chemical Society. 172–85. Saltzman, M.1986. Analysis of dyes in museum textiles; or, You can't tell a dye by its color. In Textile conservation symposium in honor of Pat Reves, ed.C. C.McLean and P.Connel. Los Angeles: Conservation Center, Los Angeles County Museum of Art. 32–39. Saltzman, M.1992. Identifying dyes in textiles. American Scientist80:474–81. Saltzman, M., A. M., Keay,, and J., Christensen. 1963. The identification of colorants in ancient textiles. Dyestuffs44:241–51. Schweppe, H.1986. Identification of dyes in historic textile materials. In Historic textile and paper materials: Conservation and characterization, ed.H. L.Needles and S. H.Zeronian. Advances in Chemistry series 212. Washington, D.C.: American Chemical Society. 153–74. Schweppe, H.1988. Practical information for the identification of dyes on historic textile materials. Washington, D.C.: Smithsonian Institution Press. Thompson, R. H.1971. Naturally occurring quinones. 3d ed.New York: Academic Press. Trottman, E. R.1975. Dyeing and chemical technology of textile fibres. 5th ed.London: Griffin.
Walker, C., and H. L.Needles. 1986. Analysis of natural dyes on wool substrates using reverse-phase high-performance liquid chromatography. In Historic West, T. S., and A. S.Sykes. 1958. Analytical applications of diamino-ethane-tetra-acetic acid. Poole, Eng.: British Drug House. Wouters, J., 1985. High performance liquid chromatography of anthraquinones: Analysis of plant and insect extracts and dyed textiles. Studies in Conservation30:119–28. Wouters, J., and N.Rosario-Chirinos. 1992. Dye analysis of pre-Columbian Peruvian textiles with high-performance liquid chromatography and diode-array detection. Journal of the American Institute for Conservation31:237–55. Wouters, J., and A.Verhecken. 1985. High-performance liquid chromatography of anthraquinones: Analysis of plant and insect extracts and dyed textiles. Studies in Conservation30:119–28. Wouters, J., and A.Verhecken. 1987. The chemical nature of flavokermesic acid. Tetrahedron Letters28:1199–202. Wouters, J., and A.Verhecken. 1989a. The coccid insect dyes: HPLC and computerized diode-array analysis of dyed yarns. Studies in Conservation34:189–200. Wouters, J., and A.Verhecken. 1989b. The scale insect dyes (Homoptera: Coccoidea): Species recognition by HPLC and diode-array analysis of the dyestuffs. Annales de la Societe Entomologique Fran�aise25:393–410. Young, W. J.1957. Appendix III: Analysis of textile dyes. Papers of the Peabody Museum of Archaeology and Ethnology50:53–54. AUTHOR INFORMATIONERICA J. TIEDEMANN holds an M.S. in textile science from the University of Illinois Urbana-Champaign and is working on a Ph.D. at Ohio State University. Address: Department of Textiles and Clothing, 1787 Neil Ave., Columbus, Ohio 43210. YIQI YANG holds an M.S. in textile chemical engineering from China Textile University and a Ph.D. in textile science from Purdue University. He is a professor and senior research engineer in textile coloring and finishing at the Institute of Textile Technology. Address: Institute of Textile Technology, 2551 Ivy Road, Charlottesville, Va. 22903.
 Section Index Section Index |