EFFECTS OF AQUEOUS TREATMENT ON ALBUMEN PHOTOGRAPHSPAUL MESSIER, & TIMOTHY VITALE
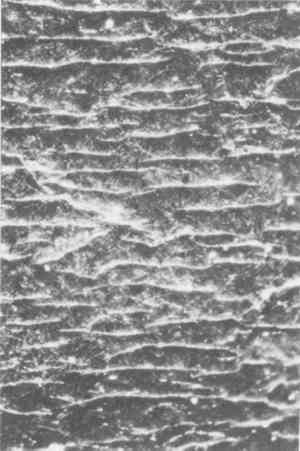
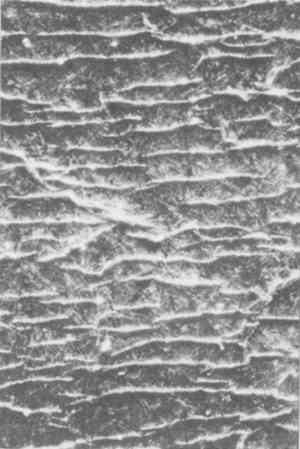
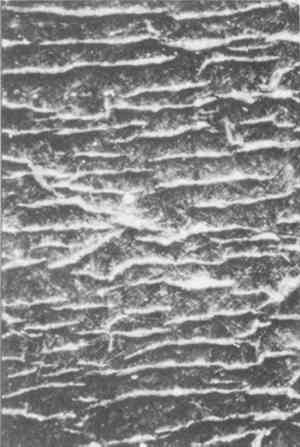
3 RESULTS3.1 DIMENSIONAL CHARACTERIZATION3.1.1 Albumen ThicknessThe average albumen thickness for the group of 20 prints was 13.8 μm. The average thickness for the mounted photographs was 11.2 μm. The average albumen thickness for the nevermounted photographs was 16.3 μm. Though the sample populations are far too small to make any firm statistical conclusions, the differences may point to an important trend. The reason albumen layers are less thick in mounted photographs is most likely a result of the mounting process. Mounting history appears to be an important variable. In large part, albumen prints are mounted to eliminate their strong tendency to curl. Generally, wet prints were mounted with high pressure and, in some cases, heat. The wetting, heat, and pressure sustained during mounting is undoubtedly an important variable. Since the mounted photographs tend to have thinner albumen layers, it is probable that the mounting process compresses the print surface, resulting in more even and compact albumen layers. 3.1.2 Overall Dimensional ShrinkageMeasurements taken of the 20 historical albumen prints were compared before and after complete aqueous treatment (see table 1). These measurements indicate that the group as a whole lost 0.19% in the machine direction and 0.35% in the cross-machine direction after aqueous treatment. Mounted and never-mounted photographs behave basically in the same manner. This shrinkage is contrary to the typical dimensional behavior of paper. Paper, after an initial shrinkage (which occurs as a result of the first wetting and drying of the sheet), tends to hold its dimensions except for the small differences due to hysteresis behavior. TABLE 1 DIMENSIONAL CHANGE OF HISTORICAL PRINTS AS A RESULT OF AQUEOUS TREATMENT 3.2 CRACKING3.2.1 Pretreatment CrackingBefore treatment, crack width measurements were averaged for each photograph. The crack width average for the total sample group of 20 photographs was 11.7 μm. Of the 20 photographs examined, 16 exhibited a crack pattern with a predominant 3.2.2 Increased Crack Width Following TreatmentAll 20 photographs had wider cracks after surface cleaning and immersion. Of particular interest, crack width increased the same amount after surface cleaning alone as after surface cleaning and subsequent immersion. The average crack width increase after surface cleaning was 27%. The average crack width increase after immersion following surface cleaning was 33%. Since these numbers are not distinguishable at a 95% confidence interval, the extent of crack width increase is independent of these two types of aqueous treatment when performed in succession. It should be noted that tests for the effects of immersion alone were not made; immersion was always preceded by surface cleaning. The photographs in figure 1 show a representative response for one of the photographs in the sample group.
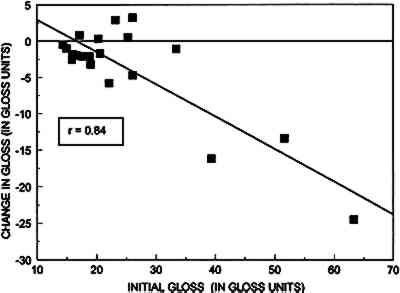
Table 2 shows the effects of the aqueous treatment on crack width. Data for mounted and never-mounted photographs are presented for the sake of comparison although these two populations are statistically indistinguishable. Note the wide range of change. All prints in this study showed an increase in crack width following treatment. Sixteen of the 20 prints have increases in crack width that are statistically significant. TABLE 2 CRACK WIDTH INCREASE DUE TO AQUEOUS SURFACE CLEANING AND IMMERSION 3.2.3 Increased Crack PopulationsThe average number of cracks for all 20 prints increased 41% from 19.9 to 28.0 over an area of 1.1158/mm2(table 3). As can be seen, TABLE 3 CRACK POPULATION INCREASES DUE TO AQUEOUS SURFACE CLEANING AND IMMERSION 3.3 GLOSS3.3.1 Pretreatment GlossThe 20 photographs included in this study had an average gloss of 25.1 gloss units. The average gloss for the never-mounted photographs was 24.0 gloss units, while the average gloss for mounted photographs was 26.2 gloss units. 3.3.2 Loss of Gloss Following TreatmentTable 4 presents the gloss data. Mounted and never-mounted photographs are presented as groups for the sake of comparison, although these two populations are statistically indistinguishable. When immersion follows surface cleaning it appears that immersion has a greater impact than aqueous surface cleaning, but the two populations are statistically indistinguishable. TABLE 4 CHANGE IN GLOSS DUE TO SURFACE CLEANING AND IMMERSION Of the 20 prints treated, 15 exhibited a decrease in gloss after complete treatment. The entire group diminished in gloss an average of 3.8 gloss units (−15%); the range of decrease was from −41% to −3%. Surface cleaning alone reduced the gloss in 15 prints, increased the gloss in 4 prints, and had no effect on 1 print. The group of four prints that increased in gloss after surface cleaning (mounted print 6 and never-mounted prints 3, 7, and 10) is not identical to the group of prints that gained gloss after immersion: one print that initially gained gloss due to surface cleaning ultimately lost gloss due to the total treatment (never-mounted print 3) and two prints that lost gloss due to surface cleaning exhibited an increase in gloss after immersion (mounted print 10 and never-mounted print 9). The range of change for the five prints that gained gloss after the total treatment was 1–13% (mounted prints 6 and 10 and never-mounted prints 7, 9, and 10). In some cases the increases are quite small. All gloss changes in this experiment are statistically significant. In figure 2 the results for total change in gloss are compared to initial gloss. Standard linear regression mathematics shows an interesting correlation (r = 0.84). The graph indicates photographs with a large amount of gloss have a high probability of losing gloss, while prints with low gloss tend to lose relatively smaller amounts of gloss after treatment.
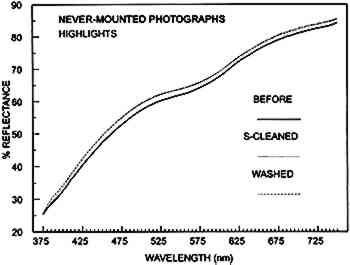
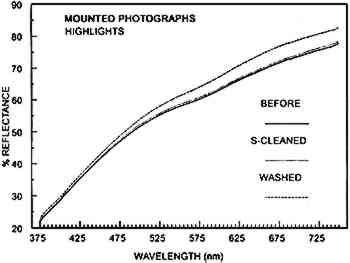
3.4 COLOR3.4.1 Color Prior to TreatmenTIn tables 5, 6, and 7 the columns on the left show the average L∗a∗b∗ values for the entire sample group before treatment. On average the albumen print highlights are lighter, less red, and more yellow than middle and maximum density areas, results that are to be expected. TABLE 5 COLORIMETRIC RESULTS FOR MAXIMUM DENSITIES TABLE 6 COLORIMETRIC RESULTS FOR MIDDLE DENSITIES TABLE 7 COLORIMETRIC RESULTS FOR HIGHLIGHTS 3.4.2 Color Change: Maximum DensitiesThere are no statistically significant changes in the data before and after treatment, when the 20 prints are averaged. However, as shown at the bottom of table 5, many individual prints do show statistically significant changes in the maximum density areas as a result of complete treatment. The summary at the bottom of table 5 lists the number of prints that were affected by aqueous treatment and average amount of change in L∗a∗b∗ units. The majority of maximum density areas were lighter, more red, and more yellow after aqueous treatment. Eleven of the 20 (55%) were measurably lighter than before treatment; 12 (60%) were slightly more red; and 18 were more yellow (90%) after treatment. 3.4.3 Color Change: Middle DensitiesThere are no statistically significant changes in the data after treatment when the 20 prints are averaged. However, table 6 shows that most individual prints show statistically significant changes as a result of treatment. The majority of middle density areas were lighter, more red, and more yellow after aqueous treatment. Twelve of the 20 (60%) were measurably lighter than before treatment; 11 (55%) were slightly more red; and 14 were more yellow (70%) after treatment. The summary at the bottom of table 6 shows the number of prints that were affected by aqueous treatment and average amount of change in L∗a∗b∗ units for middle density areas. Nine of the 11 prints that were more red after complete treatment were mounted prior to treatment. Of these nine mounted prints the average a∗ gain was 0.52 units. Following surface cleaning, only two mounted prints were more red, six were unchanged, and two were slightly less red. For the two never-mounted photographs the average a∗ gain was an imperceptible 0.06 units. These results are consistent with data reported in section 3.4.4 for print highlights. 3.4.4 Color Change: HighlightsComplete aqueous treatment generally did not decrease the characteristic yellowing of the albumen print highlights. This finding is considered to be the most important result of the color analysis. As with the maximum density data, no statistically significant changes occurred in the highlights when the entire population is averaged. However, as summarized at the bottom of table 7, most individual photographs showed For 19 of the 20 prints, highlight areas were either less red or equally red after surface cleaning. After immersion, highlights in every never-mounted print were less red after treatment, while highlights in 9 out of 10 mounted prints were more red after treatment. Immersion produced distinctly different results based upon whether or not the photograph was mounted. The data point to the possibility that soluble degradation products in albumen print mounts alter the color of the highlights and middle density areas during immersion. Table 7 presents all colorimetric results for the minimum density areas measured before treatment, after surface cleaning, and after immersion. Note the relatively large gains for the a∗ value for mounted prints after immersion. Table 8 shows the averaged spectral reflectance of the individual albumen prints, in the highlight region, after surface cleaning and then after immersion. The data are obtained by averaging the 75 individual spectral measurements taken every 5 nm from 375 nm to 750 nm, using the equation (dR/R0)100 where R0 is the percent reflectance before treatment and dR is the change in percent reflectance due to treatment. With the exception of never-mounted print 9, surface cleaning generally produces relatively small percentage increases in reflectance for both never-mounted and mounted photographs. The increase in reflectance is attributed to the removal of dirt because, in all cases, the swabs used in surface cleaning were visibly soiled after treatment. The data also indicate that when immersion follows surface cleaning there is an additional increase in reflectance. TABLE 8 AVERAGE PERCENT CHANGE IN REFLECTANCE ACROSS THE VISIBLE SPECTRUM FOR ALBUMEN PRINT HIGHLIGHTS When data for individual prints are compared within groups (with the exception of never-mounted print 9), there is a fairly uniform increase in reflectance due to both surface cleaning and immersion. Whether or not a print is mounted appears to influence the changes in reflectance due to dirt removal, although it is not known if the mounted prints were “dirtier” than the never-mounted prints. Figures 3 and 4 show the averaged spectral reflectance curves for the highlights of the group of never-mounted and the group of mounted photographs. Due to the wide variation of color within these two groups, the differences are not statistically significant (this finding is in agreement with the previously reported L∗a∗b∗ results). Figures 3 and 4, however, provide useful visualizations of the effects of treatment. As indicated by the graphs, aqueous treatment results in generally uniform increases in reflectance across the visible spectrum.
An exception is the disproportionately large increases in reflectance in the yellow-orange-red end of the spectrum resulting from immersion of mounted prints. The majority of this increase occurs above 580 nm. Prior to 580 nm, the percent increase is 4.7%. After 580 nm, there is a 6.9% increase. Since the increase is uneven across the spectrum, the proportionately higher increase in yellow-orange-red reflectance cannot be attributed to the removal of dirt. Again, as the colorimetric data show, there is evidence that highlights of mounted prints are more red after immersion. Also of note is the very pronounced trough feature in the curve for the never-mounted prints, which runs from 525 nm to 625 nm. Less reflectance in this region indicates that the never-mounted photographs are less yellow than the mounted prints. This conclusion is in |