EFFECTS OF AQUEOUS TREATMENT ON ALBUMEN PHOTOGRAPHSPAUL MESSIER, & TIMOTHY VITALE
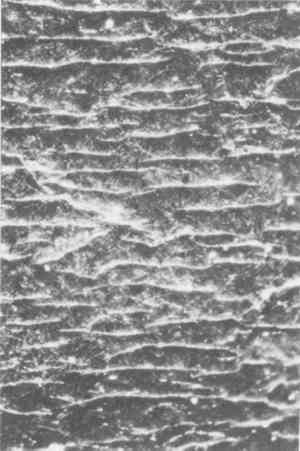
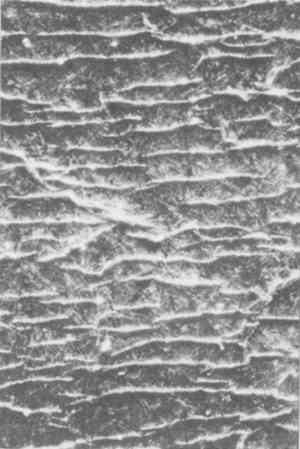
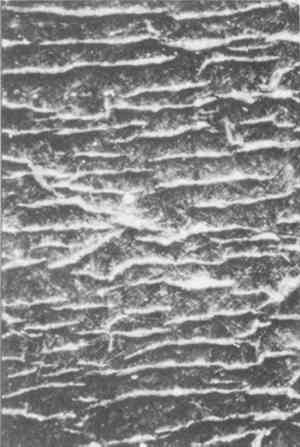
ABSTRACT—Research was carried out to assess the current conservation practice of the aqueous surface cleaning and the unmounting and washing of albumen photographs, techniques adapted from paper conservation and photographic processing. In this study, 10 mounted and 10 never-mounted albumen photographs were both surface cleaned with and immersed in aqueous solutions, and the photographs measured before and after treatment for print color, gloss, and nature of albumen cracking. The measurements were carried out using a spectrocolorimeter, a glossmeter, and photomicrographs. The results of the study show that aqueous treatment, be it surface cleaning or immersion, does nothing to improve the discoloration of the image, while it does increase the cracking of the albumen layer and decrease the surface gloss. 1 INTRODUCTIONThe aqueous surface cleaning, unmounting, and immersion of albumen prints are among treatment options used in the craft practice of photographic conservation. The association of albumen photographs with water is a natural one. Albumen photographs are born of water. Photographic processing has always involved the use of aqueous solutions that are followed by prolonged water baths. In particular, the washing of albumen photographs has traditionally been associated with preservation. Nineteenth-century albumen printers were very aware of the link between image permanence and extensive postprocessing washing in clean water. During manufacture, albumen photographs often go through several cycles of wetting and drying. Not only are they thoroughly washed, but prints are fixed and toned in aqueous solutions. In the 20th century, paper conservation practice has often involved the washing of degraded or discolored paper artifacts. After bathing, paper artifacts are often perceived to be whiter, stronger, and healthier (Vitale 1992a). As the field of photographic conservation evolved, it naturally adapted techniques and approaches from both paper conservation and photographic processing. Evaluation of aqueous treatment of albumen photographs is not new. Alice Swan (1981) made several observations on the detrimental effects of water on albumen photographs. Swan asserted that albumen prints treated with water exhibited an increase in albumen layer cracking, but she did not quantify the phenomenon. She also expressed concern that aqueous treatment seemed to cause an overall “contraction” of the albumen (1981, 276). Although alarming, the aqueous treatment of albumen prints is still (Moor and Moor 1991), with some exceptions (Hill 1991), a traditional technique that remains an accepted practice in photographic conservation. The perceived benefits of aqueous treatment are: (1) aqueous surface cleaning is a quick and effective means for removing dirt and accretions; (2) aqueous immersion is often a reliable method for removing albumen photographs from degraded, damaged mounts; and (3) the washing of albumen prints may reduce the presence of degradation products in the paper support and may decrease the yellow-brown discoloration in the albumen layer. The purpose of this research was to assess the aqueous treatment regime and determine its benefits and risks. Prior to treatment, print 2.1 MATERIALS AND METHODS2.1.1 Experimental GroupThe 20 19th-century albumen photographs selected for this study typify the mature albumen printing process used between the mid-1860s and the 1890s. They have a moderate to high sheen. Ten of the photographs were mounted to heavy paperboard; 10 had never been mounted. All appear to have been coated with albumen by large-scale, commercial manufacturers. Prints were selected to avoid additional variables, such as tinting with aniline dyes or silver mirroring. An attempt was made to secure photographs with diverse origins. Of the 10 never-mounted prints, 7 are by various photographers active in the American West, and three originate from the same photographic publishing house in Paris. The seven American photographs came from the same institutional collection. Of the 10 mounted photographs, 3 are German, 2 are American, 2 are English, and 1 is of French, 1 of Italian, and 1 of Spanish origin. All mounted prints are from two private collections. 2.1.2 Dimensional CharacterizationPrior to treatment the photographs were measured along the machine direction and cross-machine direction of the paper base. Albumen thickness was measured using a Leitz Component Measuring Microscope (McCormick-Goodhart 1989). With this device the top layer of the albumen is brought into focus. The microscope is then focused through the albumen layer to the paper fibers below. The resulting focal length displacement is digitally recorded. This technique is capable of accuracy up to 0.3 μm. There is, however, no compensation for the index of refraction of the albumen, which makes the albumen coating appear very slightly thinner. A drawback to this technique, when applied to albumen prints, is that albumen thickness is widely variable across the surface of the same photograph. To help compensate for the irregular nature of the coating, 10 measurements of randomly selected areas were made for each photograph. The 10 measurements were then averaged. 2.1.3 Characterization of Albumen CrackingAfter considering many techniques to quantify albumen cracking, the simplest alternative proved to be the best. A representative area on each photograph was chosen. This area was always well away from the edges of the photograph. Areas of abrasion or other damage were avoided. The area (1.1158 mm2) was photographed through a microscope at 44.5�. The film used was Polaroid PolaGraph High Contrast 35 mm film, chosen because the enhanced contrast emphasized crack delineation. The samples were lit with a raking light, which was kept constant for all photographs. A polyester template with cutout openings was created so the areas examined could be returned to after surface cleaning and washing. The resulting slides were projected onto a smooth, reflective surface. Cracks were measured at their widest point using a ruler in mm. To ensure the same projected magnification for each slide, a calibration slide was made. The calibration slide showed a micrometer with a measured distance of 0.1 mm also at 44.5�. Prior to making measurements from the projected slides, the magnification on the slide projector was adjusted so that the 0.1 mm distance The slides were projected onto the reflective surface in treatment sequence. Characteristic cracks from the first slide were traced on the reflective surface. After measurements were taken, the same cracks in the after treatment slides were superimposed on these markings. This technique ensured that the same cracks were measured across the same points before treatment, after surface cleaning, and after immersion. The number of cracks measured for each photograph was dependent upon the extent of cracking before treatment. Following treatment the number of cracks had measurably increased in all but two prints. Only cracks present in the before-treatment slides were used to calculate change in crack width. Since new cracks had smaller widths, their incorporation into crack width calculations would have biased the average. Crack population was calculated as a function of the crack width measurement process. The average number of cracks before treatment was 20.6, based on the 1.1158 mm2 measured area. Therefore, for a square inch there was an average of 12,000 cracks; for an average 8 � 10 in. print there were approximately 1 million cracks. 2.1.4 Characterization of GlossPrint gloss has always been a defining, essential photographic attribute. Gloss, with its associated benefits of image sharpness and detail, was very much an aesthetic consideration during the 19th century. As the albumen printing process developed, thinly coated albumen prints were gradually replaced by glossier prints with thicker albumen coatings. A further transformation took place as the pictorial aesthetic evolved in the late 19th and early 20th centuries. At that time, matte albumen papers (made with starch or arrowroot added to the albumen) were introduced. These papers constitute the last large-scale commercial production of albumen paper. As a physical attribute, gloss can also be used to gauge the character of a surface coating. A rough, nonuniform surface will scatter light and appear matte. On the other hand, a smooth, regular surface will reflect incident light, resulting in higher reflectance and higher gloss. Specular gloss measurements were taken with a Dr. Lange Labor Reflektometer using the 60� incident light–reflected light geometry. The ASTM Standard Method D523-85 for specular gloss was followed (ASTM 1985). The glossmeter is a relatively simple device. Measurements are based upon the difference between a known quantity of incident light projected by the instrument and the amount of reflected light detected by a photocell within the instrument. These quantities are scaled from 0 to 100. Three (30 mm2) areas across the individual photographs were measured. These areas were measured three times each. This procedure was repeated a total of three times, resulting in a total of 27 measurements per photograph. The data were averaged to yield a single, overall gloss measurement for each photograph before treatment, after surface cleaning, and after immersion. The resulting data meet the ASTM criteria for reproducibility and repeatability. Areas of potentially high wear, such as the edges of the photographs or abraded areas, were avoided when making measurements. A polyester template with cutout openings was made for each photograph so the area measured before treatment could be returned to after treatment. 2.1.5 Characterization of Albumen Print ColorThe 20 albumen prints were analyzed for color using a Hunterlab Ultrascan integrating sphere spectrocolorimeter. Diffuse illumination of the sample was achieved with a simulated Spectral measurements between 375 nm and 750 nm were made at 5 nm intervals. Data are reported as percent reflectance (%R) of a theoretical white, which is approximated by fresh fumed barium sulfate or microbeads of a solid chlorofluorocarbon (Halon). Measurements were taken in the specular-included (SIN) mode, which comprises, in part, incident reflected light. In planning the experiment, it was anticipated that different colored mounts would influence the color of print highlights. However, during initial trials it was discovered that the specular-included mode virtually eliminated the influence of colored photographic mounts on measurements of albumen print highlights. Colorimetry was chosen over the more familiar densitometry for a number of reasons. Print color can be correlated to human perception when using colorimetry. Changes in print color due to treatment could, thus, be related to human perception. A difference of 0.2 color units is generally considered to be the limit of perception for the standard observer. Colorimetry also yields spectral reflectance data across the visible spectrum. Similar to human perception, the colorimeter is more sensitive than the densitometer to changes in light colors. A slight color change in the print highlights could, therefore, be measured more accurately with the colorimeter than with the densitometer (Popson 1989). Since aqueous treatment was thought to have the greatest potential impact on areas of minimum image density, colorimetry emerged as the measuring tool of preference. Data from the colorimeter were quantified using the CIE 1976 L∗a∗b∗ (CIELAB) color scale. The scale is defined by a vertical axis and two intersecting perpendicular axes. The L∗ scale is the vertical axis measuring lightness-darkness. Along the L∗ axis L∗=0 is black, L∗=100 is white. The a∗ scale measures redness-greenness. Positive values for a∗ measure the amount of red; negative values measure the amount of green. Similarly, b∗ values measure the amount of blue or yellow. Positive b∗ values measure the amount of yellow; negative b∗ values measure the amount of blue. L∗a∗b∗ data were gathered for the albumen print maximum density areas, middle density areas, and highlights. Polyester templates with cutout openings were used so the exact area measured (0.375 in diameter) before treatment could be measured after surface cleaning and immersion. It was determined that five individual readings for each area were sufficient to produce repeatable results with acceptable standard deviation. 2.2 EXPERIMENTAL DESIGNOnce fully characterized, the 20 photographs were treated. The treatments were designed to best approximate common conservation practice. The experimental philosophy was to follow the effects of a common treatment protocol rather than the independent effects of surface cleaning or immersion. The latter experimental design would have required twice the number of prints if performed at the same level of accuracy. Note that the data used in a previous report on this work (Messier and Vitale 1993a) have been recalculated. The previous report concentrated only on gauging the width gain of pre-existing cracks. Following that report, it became apparent that means existed to gauge the formation of new cracks. This assessment of new crack formation required a repetition of crack measurements for the never-mounted photographs. Measurements were also collected for the mounted photographs (these measurements were not previously reported). The current data for crack width increase for the never-mounted photographs are lower by approximately 10–12%, a range within the 95% confidence intervals previously reported. The photographs were first surface cleaned with deionized water applied with cotton swabs. After surface cleaning, the mounted photographs were air-dried, while the unmounted photographs were dried between smooth photographic blotters and under weight (0.1 psi) to minimize planar distortion. Once dry, color, gloss, and crack width and population data were collected again. The photographs were immersed in baths of deionized water. The never-mounted photographs were immersed for 1 hour, then transferred to a final bath of fresh deionized water for 15 minutes. Photographs with mounts were immersed until they could be safely separated from their mounts with gentle manipulations of a Teflon spatula. Length of immersion time varied from approximately 1 hour to up to 4 hours. Immersion times were noted, though it became clear that the amount of time spent in water had no correlation to the amount of change measured after treatment. Once unmounted, each photograph was placed in a fresh bath of deionized water for 15 minutes. Following immersion, both sets of mounted and never-mounted photographs were allowed to air-dry face up until the surface gloss was gone (approximately 10–15 minutes). They were then placed between smooth photographic blotters and under light pressure (0.1 psi) until dry. The blotters were changed once after 15 minutes. The photographs remained between blotters for approximately 48 hours before the effect of treatment was assessed. There was no evidence of albumen adhering to the blotters. 3 RESULTS3.1 DIMENSIONAL CHARACTERIZATION3.1.1 Albumen ThicknessThe average albumen thickness for the group of 20 prints was 13.8 μm. The average thickness for the mounted photographs was 11.2 μm. The average albumen thickness for the nevermounted photographs was 16.3 μm. Though the sample populations are far too small to make any firm statistical conclusions, the differences may point to an important trend. The reason albumen layers are less thick in mounted photographs is most likely a result of the mounting process. Mounting history appears to be an important variable. In large part, albumen prints are mounted to eliminate their strong tendency to curl. Generally, wet prints were mounted with high pressure and, in some cases, heat. The wetting, heat, and pressure sustained during mounting is undoubtedly an important variable. Since the mounted photographs tend to have thinner albumen layers, it is probable that the mounting process compresses the print surface, resulting in more even and compact albumen layers. 3.1.2 Overall Dimensional ShrinkageMeasurements taken of the 20 historical albumen prints were compared before and after complete aqueous treatment (see table 1). These measurements indicate that the group as a whole lost 0.19% in the machine direction and 0.35% in the cross-machine direction after aqueous treatment. Mounted and never-mounted photographs behave basically in the same manner. This shrinkage is contrary to the typical dimensional behavior of paper. Paper, after an initial shrinkage (which occurs as a result of the first wetting and drying of the sheet), tends to hold its dimensions except for the small differences due to hysteresis behavior. TABLE 1 DIMENSIONAL CHANGE OF HISTORICAL PRINTS AS A RESULT OF AQUEOUS TREATMENT 3.2 CRACKING3.2.1 Pretreatment CrackingBefore treatment, crack width measurements were averaged for each photograph. The crack width average for the total sample group of 20 photographs was 11.7 μm. Of the 20 photographs examined, 16 exhibited a crack pattern with a predominant 3.2.2 Increased Crack Width Following TreatmentAll 20 photographs had wider cracks after surface cleaning and immersion. Of particular interest, crack width increased the same amount after surface cleaning alone as after surface cleaning and subsequent immersion. The average crack width increase after surface cleaning was 27%. The average crack width increase after immersion following surface cleaning was 33%. Since these numbers are not distinguishable at a 95% confidence interval, the extent of crack width increase is independent of these two types of aqueous treatment when performed in succession. It should be noted that tests for the effects of immersion alone were not made; immersion was always preceded by surface cleaning. The photographs in figure 1 show a representative response for one of the photographs in the sample group.
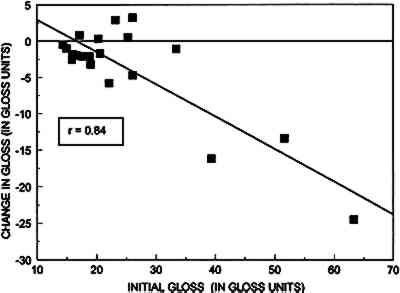
Table 2 shows the effects of the aqueous treatment on crack width. Data for mounted and never-mounted photographs are presented for the sake of comparison although these two populations are statistically indistinguishable. Note the wide range of change. All prints in this study showed an increase in crack width following treatment. Sixteen of the 20 prints have increases in crack width that are statistically significant. TABLE 2 CRACK WIDTH INCREASE DUE TO AQUEOUS SURFACE CLEANING AND IMMERSION 3.2.3 Increased Crack PopulationsThe average number of cracks for all 20 prints increased 41% from 19.9 to 28.0 over an area of 1.1158/mm2(table 3). As can be seen, TABLE 3 CRACK POPULATION INCREASES DUE TO AQUEOUS SURFACE CLEANING AND IMMERSION 3.3 GLOSS3.3.1 Pretreatment GlossThe 20 photographs included in this study had an average gloss of 25.1 gloss units. The average gloss for the never-mounted photographs was 24.0 gloss units, while the average gloss for mounted photographs was 26.2 gloss units. 3.3.2 Loss of Gloss Following TreatmentTable 4 presents the gloss data. Mounted and never-mounted photographs are presented as groups for the sake of comparison, although these two populations are statistically indistinguishable. When immersion follows surface cleaning it appears that immersion has a greater impact than aqueous surface cleaning, but the two populations are statistically indistinguishable. TABLE 4 CHANGE IN GLOSS DUE TO SURFACE CLEANING AND IMMERSION Of the 20 prints treated, 15 exhibited a decrease in gloss after complete treatment. The entire group diminished in gloss an average of 3.8 gloss units (−15%); the range of decrease was from −41% to −3%. Surface cleaning alone reduced the gloss in 15 prints, increased the gloss in 4 prints, and had no effect on 1 print. The group of four prints that increased in gloss after surface cleaning (mounted print 6 and never-mounted prints 3, 7, and 10) is not identical to the group of prints that gained gloss after immersion: one print that initially gained gloss due to surface cleaning ultimately lost gloss due to the total treatment (never-mounted print 3) and two prints that lost gloss due to surface cleaning exhibited an increase in gloss after immersion (mounted print 10 and never-mounted print 9). The range of change for the five prints that gained gloss after the total treatment was 1–13% (mounted prints 6 and 10 and never-mounted prints 7, 9, and 10). In some cases the increases are quite small. All gloss changes in this experiment are statistically significant. In figure 2 the results for total change in gloss are compared to initial gloss. Standard linear regression mathematics shows an interesting correlation (r = 0.84). The graph indicates photographs with a large amount of gloss have a high probability of losing gloss, while prints with low gloss tend to lose relatively smaller amounts of gloss after treatment.
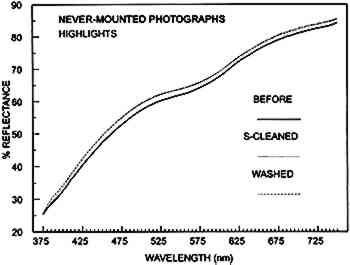
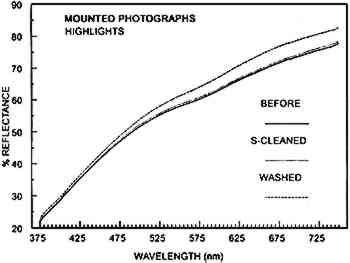
3.4 COLOR3.4.1 Color Prior to TreatmenTIn tables 5, 6, and 7 the columns on the left show the average L∗a∗b∗ values for the entire sample group before treatment. On average the albumen print highlights are lighter, less red, and more yellow than middle and maximum density areas, results that are to be expected. TABLE 5 COLORIMETRIC RESULTS FOR MAXIMUM DENSITIES TABLE 6 COLORIMETRIC RESULTS FOR MIDDLE DENSITIES TABLE 7 COLORIMETRIC RESULTS FOR HIGHLIGHTS 3.4.2 Color Change: Maximum DensitiesThere are no statistically significant changes in the data before and after treatment, when the 20 prints are averaged. However, as shown at the bottom of table 5, many individual prints do show statistically significant changes in the maximum density areas as a result of complete treatment. The summary at the bottom of table 5 lists the number of prints that were affected by aqueous treatment and average amount of change in L∗a∗b∗ units. The majority of maximum density areas were lighter, more red, and more yellow after aqueous treatment. Eleven of the 20 (55%) were measurably lighter than before treatment; 12 (60%) were slightly more red; and 18 were more yellow (90%) after treatment. 3.4.3 Color Change: Middle DensitiesThere are no statistically significant changes in the data after treatment when the 20 prints are averaged. However, table 6 shows that most individual prints show statistically significant changes as a result of treatment. The majority of middle density areas were lighter, more red, and more yellow after aqueous treatment. Twelve of the 20 (60%) were measurably lighter than before treatment; 11 (55%) were slightly more red; and 14 were more yellow (70%) after treatment. The summary at the bottom of table 6 shows the number of prints that were affected by aqueous treatment and average amount of change in L∗a∗b∗ units for middle density areas. Nine of the 11 prints that were more red after complete treatment were mounted prior to treatment. Of these nine mounted prints the average a∗ gain was 0.52 units. Following surface cleaning, only two mounted prints were more red, six were unchanged, and two were slightly less red. For the two never-mounted photographs the average a∗ gain was an imperceptible 0.06 units. These results are consistent with data reported in section 3.4.4 for print highlights. 3.4.4 Color Change: HighlightsComplete aqueous treatment generally did not decrease the characteristic yellowing of the albumen print highlights. This finding is considered to be the most important result of the color analysis. As with the maximum density data, no statistically significant changes occurred in the highlights when the entire population is averaged. However, as summarized at the bottom of table 7, most individual photographs showed For 19 of the 20 prints, highlight areas were either less red or equally red after surface cleaning. After immersion, highlights in every never-mounted print were less red after treatment, while highlights in 9 out of 10 mounted prints were more red after treatment. Immersion produced distinctly different results based upon whether or not the photograph was mounted. The data point to the possibility that soluble degradation products in albumen print mounts alter the color of the highlights and middle density areas during immersion. Table 7 presents all colorimetric results for the minimum density areas measured before treatment, after surface cleaning, and after immersion. Note the relatively large gains for the a∗ value for mounted prints after immersion. Table 8 shows the averaged spectral reflectance of the individual albumen prints, in the highlight region, after surface cleaning and then after immersion. The data are obtained by averaging the 75 individual spectral measurements taken every 5 nm from 375 nm to 750 nm, using the equation (dR/R0)100 where R0 is the percent reflectance before treatment and dR is the change in percent reflectance due to treatment. With the exception of never-mounted print 9, surface cleaning generally produces relatively small percentage increases in reflectance for both never-mounted and mounted photographs. The increase in reflectance is attributed to the removal of dirt because, in all cases, the swabs used in surface cleaning were visibly soiled after treatment. The data also indicate that when immersion follows surface cleaning there is an additional increase in reflectance. TABLE 8 AVERAGE PERCENT CHANGE IN REFLECTANCE ACROSS THE VISIBLE SPECTRUM FOR ALBUMEN PRINT HIGHLIGHTS When data for individual prints are compared within groups (with the exception of never-mounted print 9), there is a fairly uniform increase in reflectance due to both surface cleaning and immersion. Whether or not a print is mounted appears to influence the changes in reflectance due to dirt removal, although it is not known if the mounted prints were “dirtier” than the never-mounted prints. Figures 3 and 4 show the averaged spectral reflectance curves for the highlights of the group of never-mounted and the group of mounted photographs. Due to the wide variation of color within these two groups, the differences are not statistically significant (this finding is in agreement with the previously reported L∗a∗b∗ results). Figures 3 and 4, however, provide useful visualizations of the effects of treatment. As indicated by the graphs, aqueous treatment results in generally uniform increases in reflectance across the visible spectrum.
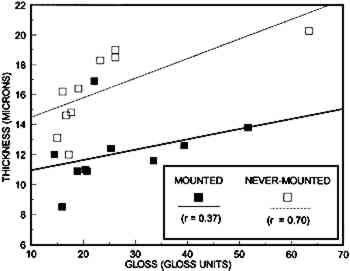
An exception is the disproportionately large increases in reflectance in the yellow-orange-red end of the spectrum resulting from immersion of mounted prints. The majority of this increase occurs above 580 nm. Prior to 580 nm, the percent increase is 4.7%. After 580 nm, there is a 6.9% increase. Since the increase is uneven across the spectrum, the proportionately higher increase in yellow-orange-red reflectance cannot be attributed to the removal of dirt. Again, as the colorimetric data show, there is evidence that highlights of mounted prints are more red after immersion. Also of note is the very pronounced trough feature in the curve for the never-mounted prints, which runs from 525 nm to 625 nm. Less reflectance in this region indicates that the never-mounted photographs are less yellow than the mounted prints. This conclusion is in 4 DISCUSSION4.1 NOTE ON USE OF BLOTTERSChange in gloss due to contact of wet prints with blotter paper merits consideration. The results of the experiment indicate the effect of blotters on gloss appears to be minimal. Table 4 shows even though blotters were not used on the mounted prints after surface cleaning (see section 2.2), loss of gloss is exactly the same for the air-dried and blotter-dried samples. It can be concluded, therefore, that the use of blotters had no effect in altering gloss. A possibility also exists that immersion causes a greater degree of swelling and softening of the albumen as compared to surface cleaning (see section 2.2). If the albumen layer is softened substantially more by immersion, then the surface of the albumen layer could be altered by the use of blotters during drying. However, there was no overt evidence of this effect observed during the project. Cumulative treatment experience indicates that the surfaces of wet, historical albumen prints never stick to blotters during drying. In Vitale and Messier (1994) the literature concerning silver hardening of the albumen layer during sensitization is reviewed. Though not quantified, the historical and anecdotal information from albumen print makers affirm that sensitized albumen layers are reasonably tough when wet. These observations, taken with the heavy metal sequestering action of the sulfhydryl groups and pendant oxygen and nitrogen, suggest that silver sequestering is the probable cause of the “hardened” behavior. 4.2 INTEGRATION OF RESULTSWhen the initial gloss of all 20 prints is averaged, there is no link between gloss and albumen thickness. This fact contradicts the accepted wisdom that thicker albumen coatings yield a glossier surface. When the mounted and never-mounted photographs are considered as separate populations, a relationship emerges. Figure 5 shows that thicker albumen coatings result in a glossier prints within mounted or never-mounted groups. The low r values (r = 0.37 for mounted photographs, r = 0.70 for never-mounted photographs) reflect the fact that the data are from historical artifacts that have numerous variables built in during manufacture and that other variables that can intervene
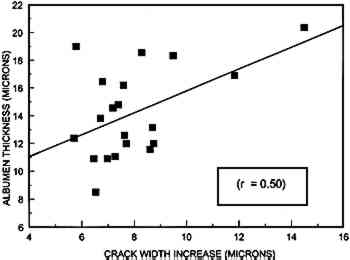
Figure 6 shows the relationship between albumen thickness and crack width increase. Although logical to assume such a relationship exists, the presence of other variables appears to deter a stronger relationship. The plot (r = 0.50) suggests that thicker albumen coatings generally exhibit a greater degree of cracking after aqueous treatment. However, deviation of individuals from the plotted regression (mean) suggests the unknown histories of individual prints play an important factor.
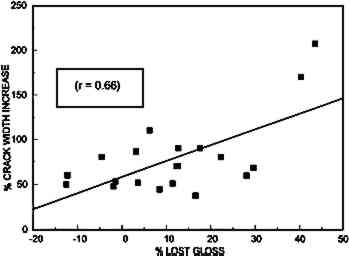
Figure 7 shows the relationship between albumen crack width increase and loss in gloss. Undoubtedly surface cleaning removes dust particles and loosely imbedded particles, which would scatter light, and this change results in some increase in gloss. It is also reasonable to expect that immersion frees up additional particles that are lodged between cracks in the albumen layer. The switching of two prints into the gloss-increased group after their gloss had decreased slightly during surface cleaning (as noted in section 3.3.2) is most likely explained by the opposing effects of crack width increase that decreases gloss and dirt removal that increases gloss. It must be noted, however, that the prints with increases in gloss do not correspond to those prints that show substantial increase in highlight lightness, L∗ (see table 7). Factors other than dirt removal must contribute to increase in gloss.
Gloss decrease would appear to be due to the massive, 69% increase in crack width (see table 2) and the 41% increase in crack population (see table 3). The average crack expands from 11.7 μm to 19.7 μm, and this expansion occurs for an average of 1 million cracks in an 8 � 10 in. print. Based on an 8 � 10 in. print, there are an average 410,000 additional cracks. Several practical factors must also contribute to increased light scattering, such as (1) the albumen segments between cracks probably curl up after wetting and drying (as illustrated in environmental scanning electron microscope experiment shown in Messier and Vitale 1993b), thereby deflecting light; and (2) the artifacts used for the study have unknown manufacture and storage histories. Statistical relationships plotted in this research use standard linear least squares regression mathematics to create a best fit line (Lotus 123, Release 3.1). The use of linear regressions was chosen for the sake of uniformity. Since the sample populations are relatively small, use of other types of regression calculations seemed unwarranted. It should be noted, however, that the existence of logarithmic or exponential relationships should not be ruled out, especially when there are limiting factors. 4.3 INTERPRETATION OF COLOR RESULTSSlight color changes were measured in the image highlights, medium density, and maximum density areas. These changes are primarily attributable to the removal of dirt. A layer of dirt behaves much like a neutral-density filter; each wavelength in the visible spectrum receives a slight boost in reflectance when it is removed. The slight increases in all three of the CIE L∗a∗b∗ parameters (L∗ lightness, a∗ redness, and b∗ yellowness) should be interpreted as an increase resulting from a slight increase in reflectance for all wavelengths. One cannot observe an increase in yellowness and redness while ignoring the increase in lightness. The increases in both spectral reflectance and CIE L∗a∗b∗ are congruent. The relatively large gains in spectral reflectance after 500 nm for the mounted prints (fig. 4) are statistically significant, as are the CIE L∗a∗b∗ data for some of the prints (summarized in tables 5, 6, and 7). Mounts used for albumen prints are often paperboard with paper exteriors Though proteins are slowly soluble in water, the fact that the after-treatment curves in figures 3 and 4 are similar in shape to the before-treatment curves indicates that no major chromophoric components were removed during a 1–4 hour immersion. If that were the case, the after treatment curve would have a pronounced dip in the yellow region or bump in the blue region (for example), corresponding with the reflectance of the material removed. 4.4 SUMMARY OF RESULTSALBUMEN THICKNESS
PRINT DIMENSIONS
GLOSS
CRACK WIDTH
CRACK POPULATION
COLOR
5 CONCLUSIONSThis research quantitatively establishes that the aqueous treatment of albumen photographs has serious consequences. Pre-existing cracks in albumen photographs are measurably wider after treatment, and there are additional cracks after treatment. Print gloss is reduced after treatment. Print color, particularly highlight yellowing, is not improved by aqueous treatment. Removal from a mount by aqueous immersion appears to result in some transfer of soluble colored material from the mount to the print. A practicing conservator must judge the potential merits of the aqueous treatment of albumen prints against the drawbacks. It is clear that application of water to the surface of albumen photographs causes damage. Although this damage is largely on a microscopic level, it is visually perceptible in terms of reduced gloss. In many cases this damage may be acceptablexs, if a greater preservation aim is served. The aqueous surface cleaning of an extremely soiled print, for example, may achieve a greater image clarity that outweighs the damage created by increased overall cracking. Aqueous treatment of albumen prints should not be considered routine or noninvasive. The benefits and risks of aqueous treatment need to be assessed for each individual albumen photograph prior to treatment. Alternatives to aqueous treatment, such as surface cleaning with solvents or crumbled eraser particles, warrant investigation. These alternatives may also have potential hazards. The use of polar solvents may cause excessive swelling, and rapid evaporating solvents may result in dramatic dimensional changes. The use of eraser particles may cause abrasion, and there is the risk of leaving particles in existing albumen cracks. Further work is needed to develop and assess nonaqueous treatment alternatives for albumen prints. ACKNOWLEDGEMENTSWe are indebted to Marion Mecklenburg, assistant director for conservation research at the Conservation Analytical Laboratory, Smithsonian Institution (CAL), who provided insightful guidance, read the manuscript, and made many valuable contributions. Mark McCormick-Goodhart, photographic scientist, CAL, also offered valuable advice and insights into photographic technology. Carol Grissom, chief of objects conservation, CAL, served as a tireless proofreader and made many valuable suggestions that spared the reader considerable duress. We thank Richard Harold, head of training, Hunter Laboratories, for his interpretation of our color data, especially the effects of dirt removal on color, and for fielding many general inquires about color measurement. Paula Flemming, supervisory museum specialist, Department of Anthropology, National Museum of Natural History, provided several of the prints used in the experiment; they were treated and returned. Douglas Munson of the Chicago Albumen Works provided samples of his work and valuable insight on the manufacture of albumen photographs. Our special thanks are extended REFERENCESASTM. 1985. Standard test method for specular gloss, D 523-85. Philadelphia: American Society for Testing and Materials. Hill, G.1991. The conservation of a photograph album at the National Archives of Canada.Journal of the American Institute for Conservation30:75–88. McCormick-Goodhart, M.1989. Research on collodion glass plate negatives: Coating thickness and FTIR identification of varnishes. In Topics in photographic preservation, vol 3. Washington, D.C.: Photographic Materials Specialty Group of the American Institute for Conservation. 135–50. Messier, P. A., and T. J.Vitale. 1993a. Albumen photographs: Effects of aqueous treatment and fundamental physical properties. In The imperfect image: photography, past, present and future. London: Centre for Photographic Conservation. 209–35. Messier, P. A., and T. J.Vitale. 1993b. Cracking in albumen photographs: An ESEM investigation. Microscopy Research and Technique25:374–83. Moor, I. L., and A. H.Moor. 1991. The effect of aqueous treatment on photographs. In Sauvegarde et conservation. Paris: Association pour la Recherche Scientifique sur les Art Graphiques. 62–66. Popson, S.1989. A comparison of densitometers, reflectometers, and colorimeters. Tappi Journal2(3):119–22. Swan, A.1981. Conservation of photographic print collections. Library Trends30:267–96. Vitale, T. J.1992a. Comparison between practitionerobserved and measured changes in mechanical and physical properties of paper before and after washing. AIC abstracts. American Institute for Conservation 20th annual meeting, Buffalo, N.Y. Washington, D.C.: AIC. 15–16. Vitale, T. J.1992b. Effects of water on the mechanical properties of paper and their relationship to treatment of paper. In Materials issues in art and archaeology, III, Materials Research Society Symposium Proceedings 267, ed.P.Vandiver et al. Pittsburgh: Materials Research Society. 397–427. Vitale, T. J., and P. A.Messier. 1994. Physical and mechanical properties of albumen photographs. Journal of the American Institute for Conservation33:279–99. AUTHOR INFORMATIONPAUL MESSIER is a conservator in private practice working in the Boston metropolitan area. He has an A. B. in art history from Vassar College, 1984, and an M.A. and C.A.S. in the conservation of works of art on paper from State University College at Buffalo. He worked as an apprentice in photographic materials conservation with Jose Orraca from 1985 to 1987. From 1989 to 1990 he completed an intern-ship with Anne Cartier-Bresson at the Atelier de Restauration des Photographies in Paris. He worked as a postgraduate fellow with Timothy Vitale at the Conservation Analytical Laboratory of the Smithsonian Institution where he completed research into the effect of aqueous treatment of albumen photographs in 1991. From 1991 to 1994 he was head of the paper and photographic materials conservation department at the Rocky Mountain Conservation Center in Denver. As an adjunct faculty member within the art history department at the University of Denver, he developed and taught a course designed to introduce the field of art conservation to graduate and undergraduate students. Address: 77 Griggs Rd., Brookline, Mass. 02146. TIMOTHY VITALE is currently a conservation consultant working from Aptos, California. He has a B.A. in art history from San Jose State University, 1973, and a M.S. in art conservation from the University of Delaware/Winterthur Art Conservation Program, 1977. He was a staff member at the Stanford University Museum, 1970–74, and served an apprenticeship with Sella Petri, a book conservator in San Francisco. He was head of paper conservation, Intermuseum Conservation Association, Oberlin, Ohio, 1978–82, and chief of the preservation branch, National Archives and Records Service, Washington, D.C., 1982–83. From 1983 to 1993 he worked at the Conservation Analytical Laboratory.
 Section Index Section Index |