EFFECTS OF CLIMATE CONTROL ON THE MUSEUM BUILDING ENVELOPEWILLIAM ROSE
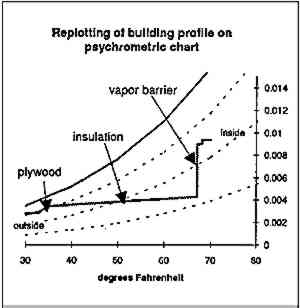
6 PSYCHROMETRIC PROFILINGThe final step in this analysis involves replotting the results of profiling (fig. 1) onto a psychrometric chart. The ASHRAE fundamentals handbook (ASHRAE 1989) gives the relations and coefficients used to achieve the replotting (fig. 9). As this plot indicates, there is a continuous segmented line that contains the same information as the two lines (vapor pressure and saturation vapor pressure) arising from the profile analysis.
The advantage of replotting the profile is this: overlays of material moisture contents and damage potential can be superimposed on the profile, giving an instant indication of the moisture content at any point in the assembly and noting any risk associated with conditions within the assembly. In the hypothetical case shown, the inside of the sheathing would be at a high moisture content, but below saturation and at a temperature too low to permit extensive mold growth. This technique overcomes the first problem posed by classical profiling techniques: that the information put out is sketchy. Now the information can include moisture content and damage risk. But the other simplifying assumptions (convection and transient effects) must be addressed. |

