EFFECTS OF CLIMATE CONTROL ON THE MUSEUM BUILDING ENVELOPEWILLIAM ROSE
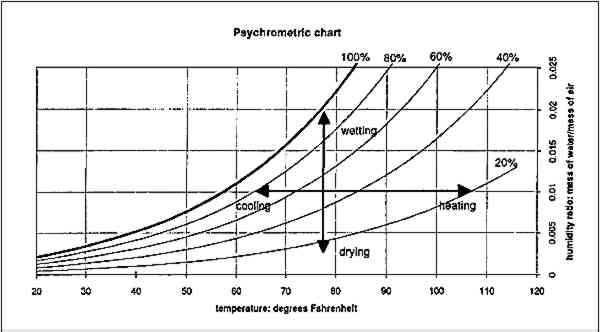
3 PSYCHROMETRICSThe science of air-water interactions is called psychrometrics. Most of psychrometrics is embodied in the psychrometric chart (fig. 2). The horizontal axis shows temperature or the kinetic energy of the air molecules. The vertical axis indicates the absolute humidity, that is, the mass of water molecules in the air. Absolute humidity can be indicated by several parameters, including vapor pressure and dew
The bold line on this chart is the line of saturation, and it indicates that warmer air can hold more moisture. Air that holds all the moisture it can hold is said to be at saturation, or 100% relative humidity. The percent degree of saturation of air is called relative humidity. On the psychrometric chart, the four processes of heating, cooling, wetting, and drying are indicated by four arrows. As can be seen, the relative humidity can be changed by changing either the humidity mass or the temperature of the air. Air that is cooled to saturation is said to have reached its dew point temperature. The psychrometric charts used by mechanical engineers contain many other lines, indicating wet-bulb temperature, enthalpy, and volume. Some of these lines can be useful: the volume of air, for example, can be used as a first-order estimate of the air leakage from a display case resulting from temperature changes within the case. The extra lines on the psychrometric chart can be ignored for the moment, particularly since the purpose of this article is to add lines to the psychrometric chart indicating relations between air and the materials that it surrounds. |
