EFFECTS OF CLIMATE CONTROL ON THE MUSEUM BUILDING ENVELOPEWILLIAM ROSE
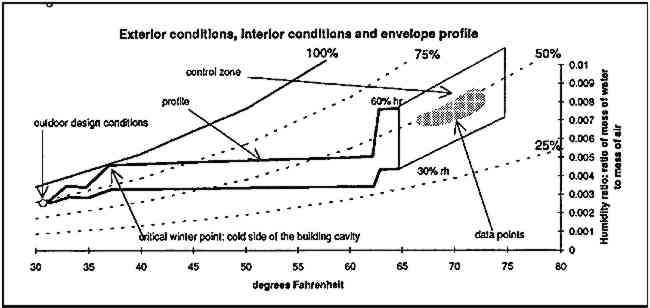
10 BUILDING MONITORINGStrip charts can be used for determining maximum and minimum values, identifying sharp spikes or changes in temperature or humidity, and establishing proof of appropriate control for visiting collections. However, strip chart hygrometers are recalibrated infrequently, so the output is suspect. Temperature and humidity data are collected but very little are analyzed. Electronic monitoring is becoming more common. Electronic data logging has several advantages over analog, recording, including facilitated microcomputer analysis of data, alarm and prompt commands, digital readout, wider range of probe instruments, conversion of output units, and the possibility of having monitoring equipment interface with the air handling system control. Electronic monitoring requires professional judgment in the selection of instruments and equipment and in the selection of locations for probe placement. Possible probe locations should be reviewed for criticality and likelihood of damage. If the building and artifacts were described as a chain, the monitoring system should record the condition of the most valuable links and of the weakest links. Recorded temperature and humidity data can be plotted on a psychrometric chart. It would be most common to see a cluster of data points like those shown in figure 13. These data points could represent data from one probe location over time, probes from several locations at one time, or both. The slight upward slope of the cluster recalls the typical condition of moisture interaction between a
Building monitoring usually involves some monitoring of the outdoor conditions. Figure 13 illustrates an overlay of (1) outdoor design conditions; (2) indoor data points; (3) a zone that limits the permissible and possible indoor conditions; and (4) a profile line connecting the indoors and outdoors. By allowing a more widely defined control zone, the stress on the envelope can be reduced. The benefits during winter of lowered indoor relative humidity are evident. |