SOME NEW ANALYTICAL TECHNIQUES FOR USE IN CONSERVATIONMICHELE R. DERRICK, ERIC F. DOEHNE, ANDREW E. PARKER, & DUSAN C. STULIK
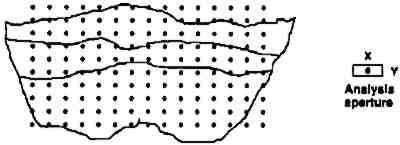
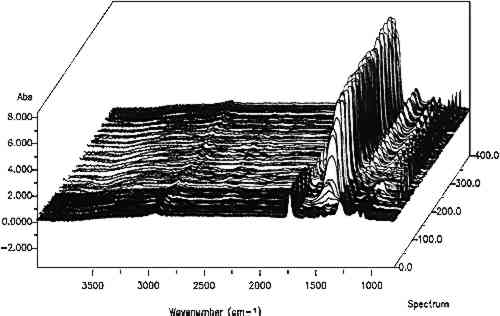
2 INFRARED MAPPING MICROSPECTROSCOPY (ORGANIC MICROPROBE)Compositional mapping of materials has been accomplished by a number of imaging technologies ranging from elemental imaging on an electron microscope to magnetic resonance imaging for medical diagnoses. Characterization of materials using infrared mapping microspectroscopy (also known as functional group mapping) has been developed for several years (Harthcock and Atkin 1988), and systems are now commercially available. Infrared mapping combines the analytical capabilities of an infrared microscope with a computer-controlled motorized stage and appropriate software programs to identify and locate various types of components, anomalies, and defects in materials. An infrared spectrum is a characteristic pattern of absorption bands that may be related to the various chemical functional groups of the material(s) being analyzed. Additionally in a multicomponent sample, the relative intensity of a functional group absorption band is For the applications presented here, area maps are obtained on embedded, polished paint cross sections. The sample is placed on the sample stage of the infrared microspectro-photometer (Spectra-Tech IRμS), and an analysis grid containing up to 600 points (e.g., 20 � 30) is selected (fig. 1) for the area of interest on the sample. An array of spectra is collected by reflection of the infrared radiation off the surface of the sample at each grid point (fig. 2). The effective resolution of the components in the sample is determined by the size of the analysis aperture and the density of the grid. The size of the aperture for these analyses was 20 � 40 μm (x, y axes, respectively). The selection of size was a trade-off between resolution and energy
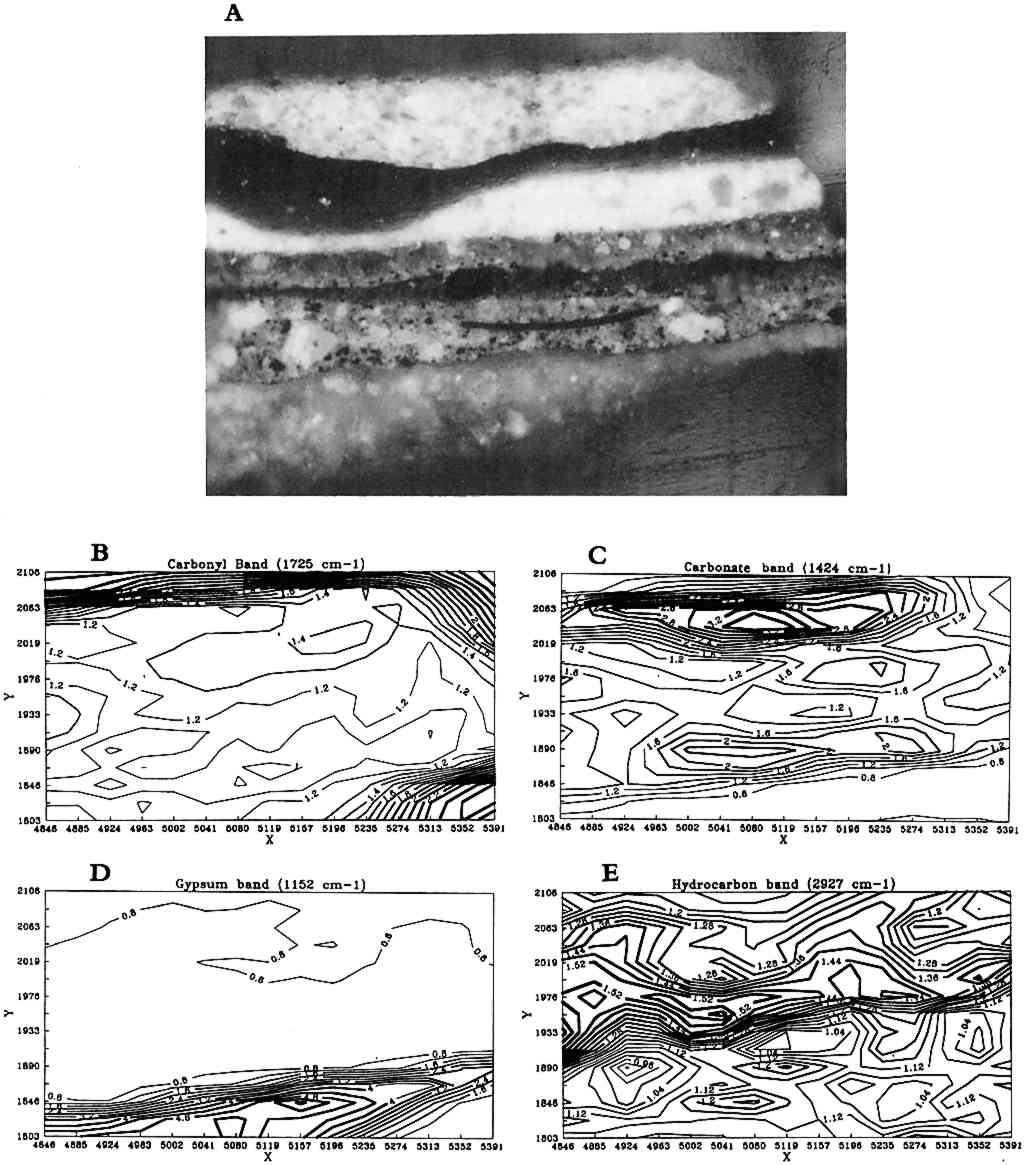
From the array of spectra, contour maps are produced that provide information on the concentration and location of compounds in the sample (fig. 3). After an absorption band of interest is selected, such as a hydrocarbon band, its intensity is plotted versus its position in the grid where it was collected. The result is an area map of the intensities of that specific band plotted as a contour map where lines connect the areas of similar value. In these black-and-white plots, line thickness has been used to represent the changes in intensity of the absorption bands. The thickest lines correspond to the areas of strongest band intensity (i.e., highest concentration in the sample), and the thinnest lines represent the lowest intensities. The intensities are relative to each other, and the background intensity may not be zero depending on the baseline in the region.
One example of infrared reflectance mapping is shown in figure 3 for a sample obtained from Dosso Dossi's Allegory of Fortune (ca. 1530–45) from the J. Paul Getty Museum. The photomicrograph of the paint cross section (fig. 3a) is marked to illustrate the area of the sample that was analyzed. Figure 3b, a plot for the carbonyl band at 1725 cm−1, shows that the highest concentration is due to the polyester embedding media surrounding the sample. The plot gives a general indication of the area analyzed. However, the area of the sample also has a consistent intensity level due to the adjacent carbonyl band for oil. Figure 3c is a plot of the carbonate band from the 1424 cm−1 region of the spectra. This plot indicates that the upper layer of the sample has the highest concentration of carbonates, corresponding to the azurite in that region. The remainder of the sample also contains lead carbonate and some calcium carbonate in the second layer from the bottom. Figure 3d is a plot of the sulfate or gypsum band in the region of 1152 cm−1. The highest concentration of this material is in the first (bottom) layer of the sample. Figure 3e is a plot of the hydrocarbon band at 2927 cm−1, corresponding to the dark green layer in the sample and probably attributable to the resin in copper resinate paint. In this particular sample, because extensive analyses had determined its components, the selected infrared absorption band and corresponding functional group can be related specifically to components in the sample. On other samples, it would be precarious to identify a material based on only one infrared absorption band. Infrared reflectance mapping shows potential for the determination of materials and their locations within a cross-section sample. The technique is complementary to elemental mapping using an electron microscope and may be done on the same sample. At this point, the method has two major limitations. The first limitation is the use of specular reflectance as an analysis method, which places a minimum size of 20 � 20 μm on the analysis window due to energy restrictions and can produce band distortions and shifts that it is difficult to compensate for. The second limitation is that a material cannot be reliably identified based on one infrared absorption band. Thus, additional analyses are required to supplement the map and provide interpretation. Future computer programs should allow a map to be created based on the selection of multiple absorption bands that can help identify specific compounds. |