INVESTIGATION INTO THE DETERIORATION OF PAINTINGS AND PHOTOGRAPHS USING COMPUTERIZED MODELING OF STRESS DEVELOPMENTMARION F. MECKLENBURG, MARK McCORMICK-GOODHART, & CHARLES S. TUMOSA
ABSTRACT—The environmental effects of temperature and relative humidity on the mechanical response of paintings and photographs were examined using numerical methods and computer analysis. The basic mathematical approach is introduced that defines the material parameters necessary to conduct such an analysis. Methods of determining the material and dimensional properties of materials with comments on the effects of increasing measurement accuracy are discussed. Using measured material properties for paintings and photographs, complete computer analyses were conducted that modeled the physical response to changing temperature and relative humidity. The calculated results were compared to experimental test specimens subjected to similar environmental variations. 1 INTRODUCTIONThe structural analysis of multilayer works of art such as paintings or photographs is complicated by the uncertainty of the mechanical properties of the individual material components and by the physical interactions between the layers. The mechanical properties are affected by temperature, relative humidity (RH), and the rate at which forces are applied to the material. For materials responding to changes in temperature and relative humidity that occur within slow but measurable time intervals, the mechanical and dimensional properties must be determined under equilibrium and quasi-equilibrium conditions. However, once the correct mechanical properties of the individual components in the object have been determined, comprehensive numerical models can be developed. The benefit of a numerical solution is that the magnitude and direction of the internal stresses as well as the dimensional distortions occurring nonuniformly in the object can be accurately evaluated. Structural failure can also be readily predicted when the calculated stress levels exceed the measured breaking stresses of the individual constituent materials. Thus, the information provided by a numerical model can be used to reassess the environments in which museum objects are exhibited, stored, and transported. In addition, numerical analysis can help evaluate proposed structural and chemical conservation treatments prior to the actual treatment. This paper expands on research presented in an earlier paper (Mecklenburg et al. 1993) and discusses the development of the mathematics, the measurements of the mechanical properties of some typical materials used in the construction of paintings and photographs, and the use of these measurements in numerical analysis. It is important to recognize that the direct measurement of stress in most cultural objects subjected to changes in temperature and RH is simply not possible. Direct stress measurements are generally valid for objects that can be considered a single homogeneous material. This is not the case for multicomponent structures like paintings and photographs, where individual materials reside in discrete regions or layers. Consider a simple two-component system composed of a paint film adhered to a rigid glass support. When the relative humidity is lowered, the glass will not respond to the desiccation, while the paint film will attempt to contract due to a loss of absorbed water. Since the paint is restrained by its adhesion to the glass support, and the glass dimensions are unchanged by decreasing relative humidity, strain gauges attached to the object will record no change in dimension and, hence, no development of stress. However, internal stresses will clearly exist within the paint and locally within the glass near the paint-glass interface. On the other hand, if the paint film is separated from the glass, stress-strain relationships can be determined for the individual paint component, but the results will not account for any interactions taking place when the paint is adhered to other layers. Thus, the only way to develop a reasonably clear picture of the total stresses in complex objects is by the application of numerical techniques. One of the most powerful analytical tools for structural analysis is the digital computer using the technique of finite element analysis (FEA) (Cook 1974). FEA readily lends itself to complex structures composed of multiple materials. The fundamental principle of the method allows one to “subdivide” a complicated structure into a “finite” number of simpler substructures called “elements” that can be assigned individual material properties (Przemienicki 1968). These elements are connected at points called “nodes” and are mathematically relatively easy to manipulate. In general, an “element stiffness matrix,” [k], is computed for each element and reflects the geometry and material properties assigned to it. All of the elements are then mathematically assembled to construct the “model structure.” This results in the “structure stiffness matrix,” [K]. This matrix represents the generalized structural behavior of the object to be analyzed. In fact, the general equation to be solved is
The forces acting on any object can be a result of external causes such as pressure, impact, and vibration, or they can develop internally due to changes in temperature, RH, and chemical composition, for example, by long-term loss of solvents (Mecklenburg and Tumosa 1991a) and volatile components (Michalski 1991). Thus, the factors that induce stress can originate externally or internally to the structure and will act to distort the structure physically. If sufficiently high, the stresses cause cracking and splitting of the structure. In general, the more elements used, the more accurate the FEA model. The displacements of the nodes represent the theoretical distortions of the structure and are the primary solution of the program. The resultant stresses and strains of each element are then computed from the displacements at the element nodes. In this way, one can get an accurate estimate of the stresses and forces acting throughout the entire structure. Experimental verification of the mathematical model can be accomplished by comparing the computer results to the displacements of actual objects subjected to vibration, impact, or, in this study, changes in temperature and RH. Since objects made of 2 THE MECHANICAL PROPERTIES OF MATERIALSAs stated, the numerical model is composed of assembled element stiffness matrices. These matrices are computed from the geometry of the actual object and the mechanical properties of the materials used to construct the object. It is essential to have this information as accurate as possible. The geometric relationships are taken directly from measurements of the object to be modeled. Determining the mechanical properties of the materials used to construct the object presents other problems altogether. For elastic structural analysis, there is no permanent deformation to the materials as a result of some applied force (Higdon et al. 1967). Many cold-temperature and low RH analyses can be treated as elastic systems, since there is little plastic deformation in such environments. Under these conditions, the mechanical properties needed for an analysis are the strength, stiffness, and coefficient of expansion for the individual materials. The strength is the maximum stress the material can sustain before breaking. The stiffness is commonly known as the modulus of a material. The modulus is the ratio of stress to strain in the elastic region of a material and relates the deformation of a material to the applied forces. In mathematical terms it is
The mechanical properties of the organic materials found in cultural objects are significantly affected by environmental parameters. For example, artists' paints—whether traditional oils, alkyds, or acrylics—get stiffer and stronger with cooling and desiccation. Oil paints also get stiffer and stronger with drying time. All paints become glassy and tend to fracture prematurely below certain temperatures, and they also start to lose strength significantly (Mecklenburg and Tumosa 1991b). These characteristics are also found in hide glues used in paintings and furniture and in gelatins used in the emulsion and anticurl layers of photographic materials. Cultural materials also demonstrate different mechanical properties depending on the rate at which the forces are applied (Mecklenburg and Tumosa 1991b). It takes time for materials to equilibrate to changes in temperature and relative humidity, so the mechanical properties needed to properly calculate the effects of temperature and humidity are those that reflect the long-term equilibrium conditions. Whereas an analysis of a structure subjected to external forces such as those encountered in shock or vibration can employ constant material properties if in a constant environment, the analyses of structures subjected to changes in environment must take into account the fact that the mechanical properties may vary as a function of the environmental parameters. It is also necessary to keep in mind that in addition to the environmentally induced changes in strength and stiffness, nearly all of the materials want to shrink with cooling and desiccation or 3 STRESS DEVELOPMENT IN FULLY RESTRAINED MATERIAL RESULTING FROM CHANGES IN TEMPERATURE AND RELATIVE HUMIDITYIf artists' materials are fully restrained and subjected to decreases in either temperature or relative humidity, they will experience an increase in tension (Mecklenburg 1982; Hedley 1988; Berger and Russell 1986, 1988). This increase results from the materials' inability to contract while undergoing cooling or desiccation. The magnitude of the tensile stress the material experiences is a function of both the attempted shrinkage and the changing modulus of the materials. In general, if the thermal coefficient of expansion and the equilibrium modulus of a material are known, the stress levels resulting from cooling a restrained material can be predicted. The method of calculating this stress increase can be derived directly from the basic eq 2, repeated here,
3.1 THE DETERMINATION OF STRAINS, ∊(T) AND ∊(RH), INDUCED BY TEMPERATURE OR RELATIVE HUMIDITYThe strain, ∊(T), as a function of temperature is derived by considering the shrinkage of the specimen as if it were free to do so. The specimen would contract upon cooling, and it is effectively being “stretched” back to its original restrained length. The “unstretched” length would be the free shrinkage length, and the deformation would be the amount needed to stretch the contracted specimen to the restrained length. The amount of shrinkage due to a temperature change is calculated from the thermal coefficient of expansion. Treating the thermal coefficient of expansion, γ, as a constant, the strain as a function of the temperature is
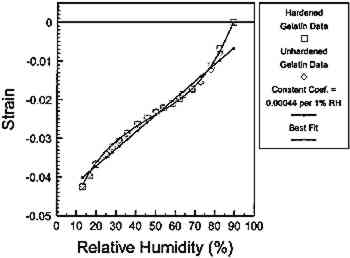
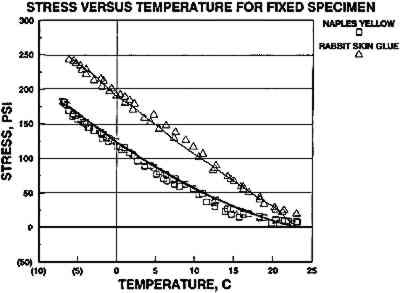
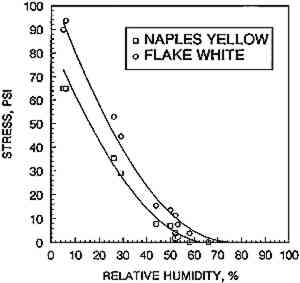
3.2 SOME VALUES OF THERMAL AND MOISTURE COEFFICIENTS OF EXPANSIONThe thermal coefficients of expansion for 13-year-old oil paints, hide glues, and photographic gelatins were measured. For one paint, a white lead, the thermal coefficient, γ, is 0.000052 per �C; for the rabbit skin glue, a thermal coefficient of about half that, or 0.000025 per �C, was measured. The thermal coefficient of expansion for photographic gelatin, γ, was 0.000030 per �C. These thermal coefficients were found to be reasonably constant over a measured range from 25�C to −10�C. In comparison, three common metals—copper, steel, and aluminum—have coefficients of 0.000017, 0.000011, and 0.000024 per �C respectively. The swelling and shrinkage of oil paints with relative humidity is highly nonlinear but can be approximated as two linear sections from 10% to 70% RH and from 70% to 95% RH. The moisture coefficient of expansion can then be treated as a constant for each of the two respective humidity ranges. For example, the low RH range moisture coefficient, αa, for the 13-year-old-white lead is αa = 0.0000257/1%RH, which is the change in strain per 1% change in relative humidity. This coefficient was used to calculate the stresses resulting from the desiccation of restrained paint. For the high relative humidity range, αb = 0.000248/1% RH, which is nearly 10 times the low range coefficient. The coefficient for the high humidity range would be rarely used since the equilibrium modulus of paints above 70% RH is nil. A nonlinear treatment of the moisture coefficient is also possible. Rabbit skin glue, traditionally used in paintings, and gelatin, typically used in image emulsions and anticurl coatings on photographic products, are both quite dimensionally responsive to RH. This characteristic is not surprising because hide glues and gelatins are chemically very similar and can absorb high levels of water into their collagen structures. As with the paints, the low RH moisture coefficients are most useful. For the rabbit skin glue, αa is 0.000264/1%RH, more than 10 times that of the paints. For the more refined and processed photographic gelatin, αa is 0.00044/1%RH. Since most photographic emulsions are chemically “hardened” to some degree to reduce swelling and dissolution during photographic wet-processing procedures, highly hardened specimens cross-linked by formalin treatment were prepared in our laboratory and compared to unhardened specimens cast from the same gelatin. Interestingly, no significant difference in mechanical properties was found between unhardened and hardened gelatin. The fully developed nonlinear functions of the coefficient of expansion for photographic gelatin were as follows: between 15% and 60% RH,
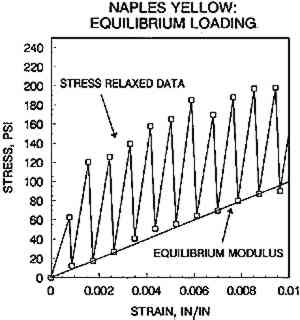
3.3 THE DETERMINATION OF MODULUS, E(T) AND E(RH), INDUCED BY TEMPERATURE OR RELATIVE HUMIDITYSeveral paints were mechanically tested under long-term loading conditions. Sample preparation and tests procedures are outlined elsewhere (Mecklenburg and Tumosa 1991b). The tests were conducted by applying a small strain to the test sample, about 0.007, and allowing it to stress relax fully. Once full stress relaxation was attained, a subsequent increment
For the Naples yellow paint, the complete equation for a fully restrained sample of paint subjected to a drop in temperature at 5% RH is now
From an experimental point of view, it is difficult to measure the stress of a fully restrained specimen since the load cell, the device that measures the stresses, is compliant. This means the cell gives a bit as force is applied to it. This load cell compliance effectively relieves some of the restraint on the specimen, and the stresses measured are actually less than if fully restrained. This compliance can, however, be included in the calculations so that the developed equations can be verified against the behavior of the specimens subjected to restraint and temperature changes. The compliance of the test device is a function of the total force and is measured during the test of the specimen. The value of the compliance, measured in units of length, is the raw data output, AO, times a compliance constant, KD. It is now possible to correct for the compliance of the load cell and calculate the expected stresses in the experimental restrained test where
E(RH) for Naples yellow paint was determined in the manner similar to that for restrained materials subjected to decreases in temperature discussed above. The results are shown in figure 4. One interesting aspect of these calculations is the remarkable accuracy using linear approximations of the actual material behavior. Equally interesting for the Naples yellow paint is the magnitude of stress reached, 0.066 ksi (0.455 MPa), when
3.4 THE EFFECTIVE MODULUS, Ee(RH), FOR RABBIT SKIN GLUE AND PHOTOGRAPHIC GELATINUntil now all of the discussions about the mechanical properties of the materials and stress development in either cooled or desiccated environments have assumed that all behavior was linear. This assumption is valid since all of the elastic modulus equations result in successful stress predictions, as shown in figures 3 and 4. For the rabbit skin glue or gelatin subjected to changes in RH, the behavior is almost never in the elastic range but exhibits a quasi-plastic, nonlinear behavior. The reason for this behavior is that the material wants to shrink extensively with desiccation. This characteristic results in strains, when the specimen is restrained and desiccated, that exceed the yield point of the material. If the stress is eliminated the material will not return to its original length. The conventional definition of modulus, specified for the elastic regime of materials only, must be replaced by an “effective modulus” as a function of relative humidity, Ee(RH). This is done by rewriting eq 4 in the following form:
For the photographic gelatin, using a constant moisture coefficient of 0.00044/1%RH, the effective modulus is
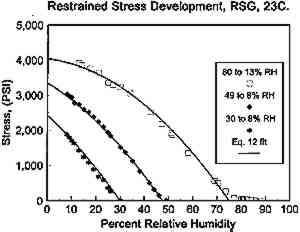
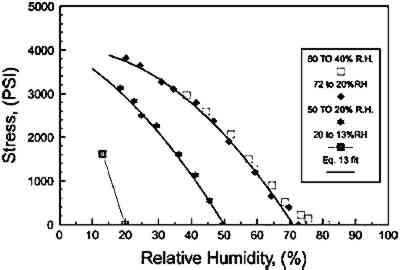
The results of the glue and gelatin modulus functions are compared to actual data in figures 5 and 6. The sample specimens were restrained at different relative humidities and desiccated. Both of the materials showed similar behavior and reach similar maximum stress values at slightly over 4 ksi (27.6 MPa). This finding is of particular interest since the coefficient of expansion of the glue is lower than that of the gelatin, and the modulus of the glue is considerably higher than that of the gelatin.
4 NUMERICAL SOLUTIONS: COMPUTER ANALYSES OF PAINTINGS AND PHOTOGRAPHSStructural analyses were conducted using finite element analysis (FEA) and the digital computer. The program used in the computer modeling in this paper was ANSYS, version 4.4, run on a 33 MHz 386 desktop computer with 4 MB RAM. 4.1 MODELING THE EFFECTS OF DESICCATING AN ILFOCHROME PRINTLow RH levels are currently recommended for long-term preservation of photographic materials because of an incremental improvement in chemical stability. For example, conditioning to 25–30% RH is recommended for color films prior to placing them in cold storage (Eastman Kodak Co. 1985). To study the physical stress and dimensional changes that can occur in a photographic material as a consequence of the recommendation, a section of an Ilfochrome
The polyester layer was modeled with the measured moisture coefficient of expansion of 0.0000077/1%RH and a modulus that varied as a function of RH:
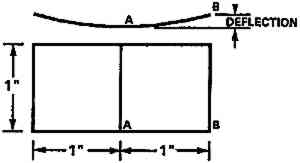
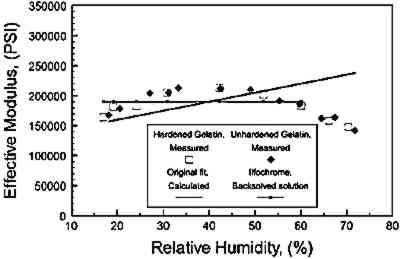
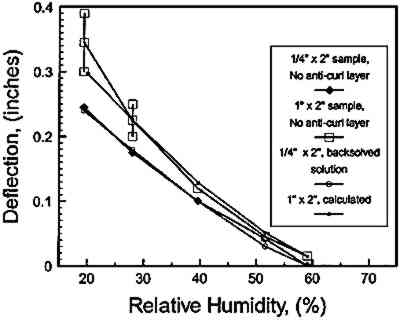
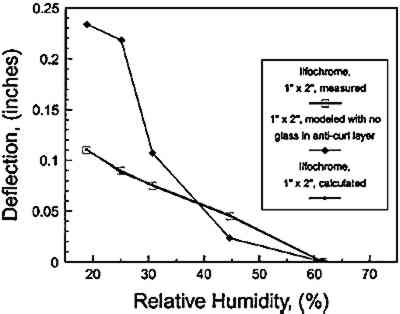
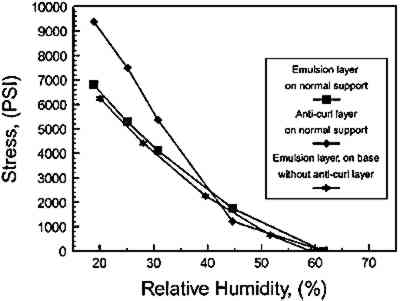
Initially, the function of Ee(RH) shown in eq 13 along with the constant moisture coefficient of expansion of 0.000044/1%RH for photographic gelatin was programmed into the computer. The role of the glass was assumed to be minor, allowing the anticurl layer to be modeled as if it were slightly stiffer and with lower coefficient of expansion similar to the properties reported for the rabbit skin glue. The results predicted for the complete Ilfochrome structure were reasonable but failed to predict accurately the behavior of an Ilfochrome specimen when the anticurl layer was removed. To refine the model, a more detailed approach was taken. The more accurate nonlinear moisture coefficient of expansion determined in our laboratory was assumed for the Ilfochrome emulsion layer: α = 0.0008 - (0.0000087 � RH). Next, the computer was used to assist in determination of an effective Ee(RH) for the emulsion layer of the print. This was accomplished by first chemically stripping the anticurl layer, cutting � � 1 in print specimens, and then measuring the deflections in different RH environments. The purpose of removing the backing layer was to simplify the model to a two-layer system. Since the mechanical properties of the polyester base layer were straightforward to measure directly (by removing all coating layers) this reduced the problem to one “unknown” layer and allowed the computer to “backsolve” for the properties of the Ilfochrome emulsion layer. Thus, by iteratively choosing Ee(RH) and “back solving” for the deflections of a � � 2 in experimental print sample using the computer, the effective modulus, Ee(RH), was calculated to be a nearly constant 190,000 psi. This result is in remarkable agreement with the properties of the photographic gelatins cast in our laboratory and measured under quasi-equilibrium restrained conditions, once the nonlinear moisture coefficient expansion was taken into consideration. As can be seen in figure 8, the results showed that the computer tended to average the effective modulus over the test environments examined. Note that the line labeled “Original Fit, Calculated,” is the effective modulus calculated using the mathematical fit from eq 13, which was developed using the constant moisture coefficient of expansion equal to 0.00044/1%RH. An important lesson in this experimental work was that fact that the computer can be an effective tool in helping to determine mechanical properties needed for analyses. In this case, it allowed us to gain confidence that the manufactured gelatin emulsion with incorporated image dyes and perhaps other proprietary chemical additives was not fundamentally different from gelatin cold-dried films hand cast in our laboratory in terms of its mechanical properties. Further, once the effective modulus for the emulsion layer was determined, the material properties for the anticurl layer could then be derived in a similar test manner. The anticurl layer was determined to function
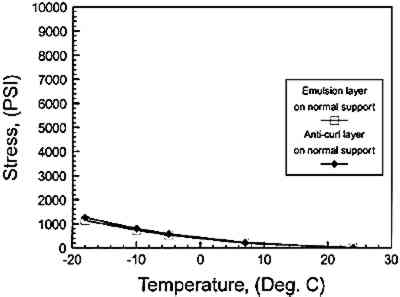
4.2 MODELING THE EFFECTS OF COOLING AN ILFOCHROME PRINTThe effects of cooling the same print results in entirely different stresses. The thermal coefficient of expansion for the photographic gelatin is γ = .000030/�C and for the polyester base, γ = (.00000616 + .00000043 � T)/�C. The effective modulus for the photographic gelatin at 50% RH was determined to be
Figure 12 shows the computed stresses in the emulsion and anticurl layers of the Ilfochrome when cooled while maintaining a constant moisture content established by 50% RH. The calculated levels are substantially lower than the stresses developed by desiccation while holding temperature constant at 22�C. Since cooling also increases the chemical stability, the numerical analysis of Ilfochrome supports the premise that long-term storage recommendations for photographic materials should weigh the merits of cooler temperatures at moderate relative humidity more highly than the use of sharply reduced relative humidity levels to achieve overall improvements in the life of photographic materials.
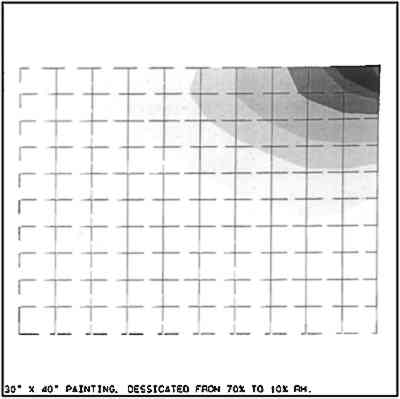
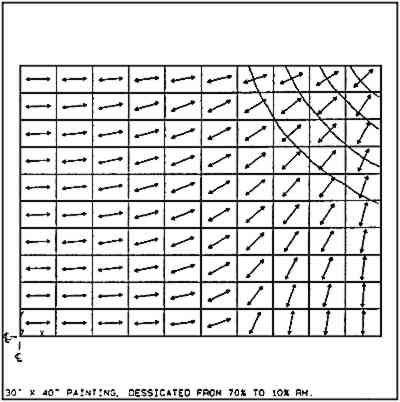
4.3 MODELING THE EFFECTS OF DESICCATING A PAINTINGA 30 � 40 in (76 � 102 cm) painting was modeled and subjected to changes in relative humidity while the ambient temperature was held at 23�C. The layer of the painting consisted of a linen 0.025 in (0.064 cm) thick, modeled as a 0.006 in (0.0152 cm) layer; a glue layer 0.004 in (0.00508 cm) thick; and a Naples yellow oil paint layer 0.003 in (0.0076 cm) thick. Test results showed that a stretched fabric developed minimal stress with desiccation. This was the result of a severely decreasing modulus with desiccation (Mecklenburg 1982). The stretcher was not expanded. Each of the layers of the model painting were programmed with their respective material properties taken from the data presented earlier in this paper. In order to obtain greater analytical detail, it was possible to take advantage of the painting's double symmetry and model only the upper right The model painting was desiccated from 70% to 10% RH at 23�C. The results of the analysis showed the stresses in the paint layer ranging from 0.1 ksi (.698 MPa) to 0.28 ksi (1.93 MPa). The distribution of the stresses are shown in figure 13. This distribution is not uniform, and high stresses occur in the corners. Cracking, if it occurs, will initiate mainly in the corner regions of the painting, as shown in the quarter-view in figure 14. In this figure, both the direction vectors of the principal stresses and the possible crack pattern are shown. If the equilibrium breaking strength of the paint at 5% RH and 23�C was low, only 0.2 ksi (1.38 MPa), the cracks would run no farther than about 3 in (7.6 cm) from the corner.
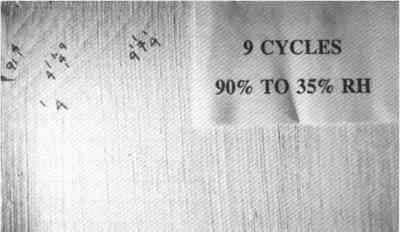
To check these results experimentally, a painting was constructed by stretching a medium-weight, basketweave linen fabric onto a 20 � 30 in (50 � 75 cm) stretcher. A rabbit skin glue size was applied warm. After the size was thoroughly dry, a gesso mixture was applied. This gesso had the mechanical properties of a brittle paint. The mixture had a pigment-volume concentration of 93 (Mecklenburg 1991), a strength of approximately 180 psi (1.24 MPa) and a rapid loading modulus of approximate 600,000 at 50% RH and 23�C. The moisture coefficient was less than 0.0001/1%RH. This coating is stiffer and weaker than one would expect from an old oil paint. The experimental painting was subjected to 9 cycles of changing RH. The cycles were
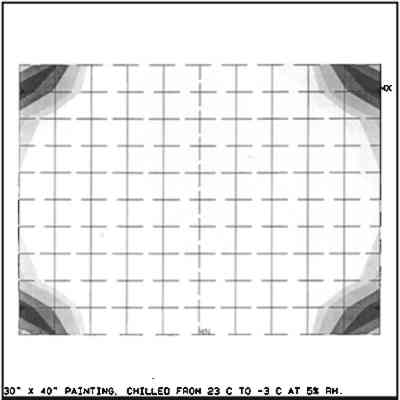
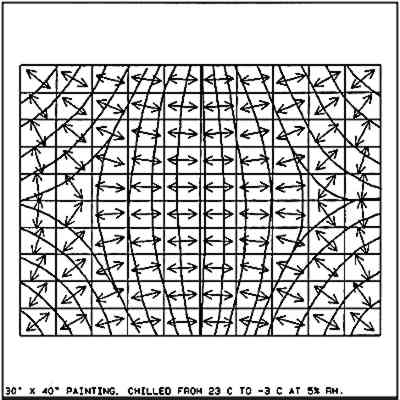
4.4 MODELING THE EFFECTS OF COOLING A PAINTINGThe same 30 � 40 in (76 � 102 cm) painting was modeled and subjected to changes in temperature while the ambient RH was held at 5%. The glue layer was characterized using a thermal coefficient of 0.000025 per �C and a changing modulus that varied linearly from 705 ksi (4,860 MPa) at −3�C to 550 ksi (3,791 MPa) at 23�C. The data were used to develop the equation
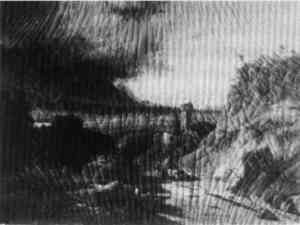
The stresses have a directional bias as shown in figure 17. The principal stresses are indicated by the calculated directional vectors (arrows), and cracking that occurs will do so perpendicular to the vectors as shown by the continuous lines. This crack pattern shows up frequently in paintings in North America, as shown in figure 18, a 19th-century landscape painting measuring 20 � 28 in. The glue layer principal stresses reached levels ranging from 4.72 MPa to 5.13 MPa (.685 ksi to .745 ksi).
5 SUMMARYTo assess the risks to cultural objects such as photographs and paintings brought about by changes in temperature or RH, an accurate determination of the stresses in the different layers of the object is necessary. In turn, those stresses must be compared to the strengths of the artists' materials at the specific environments in question and the rates of loading encountered by the object. Computer modeling in the form of finite element analysis readily lends itself to performing the needed analysis. However, the ability to numerically model multiple layered structures such as paintings and photographs is extremely dependent on an accurate determination of the mechanical properties of the constitutive materials. Reaching this determination includes assessing alterations to the mechanical properties brought about by time. This study has examined some of the materials typically found in a large proportion of canvas paintings and photographs. It has been shown that the same systematic numerical approach applies to a wide variety of multilayer materials, ranging from precision-coated photographic materials to handcrafted oil paintings on canvas. The effects of temperature and relative humidity brought about over moderately long periods of time can be modeled successfully if the material properties are characterized in an equilibrium or quasi-equilibrium state rather than using rapid-loading test data commonly used to report the mechanical properties of polymer and nonpolymer materials. A remarkably accurate representation of the deflection and image layer stresses was calculated by the computer and verified by the actual measurement of the deflection of Ilfochrome print specimens. This result was due to the development of the proper protocols necessary to establish the equilibrium mechanical properties of the polymeric materials. It was also no doubt achieved because of the precise manufacturing uniformity necessary in each coating layer of a photographic material to ensure the required product consistency. Computer modeling of a typical canvas painting with glue size and lead oil paint layers showed that deep drops in temperature at low RH (from 23� to −3�C at 5% RH) resulted in both uniform and high stresses in the paint layer. These stresses equaled or exceeded the measured breaking strengths of 13-year-old paint. Paint and glue tested at −3�C and 5% RH showed extremely brittle behavior, shattering into multiple pieces when broken. It could be inferred that an actual painting, constructed with the materials modeled, would exhibit severe and extensive cracking over the entire surface of the painting. The same computer analysis also showed that the glue layer reaches stresses slightly more than twice those of the paint layer. Computer modeling of the painting with respect to desiccation (from 70% to 10% RH) showed that crack patterns similar to those found in cooling could develop, but they would not be nearly as extensive. Finally, a comparison of the results for paintings and photographs reveals that the temperature parameter is of greater consequence to a typical oil painting on canvas, whereas RH turned out to be the more significant stress-inducing parameter for Ilfochrome photographic print media. This result confirms that optimum storage of different types of cultural objects must consider both the physical and chemical well-being of the objects in any chosen environment. Computer modeling using the method of finite element analysis provides the only suitable way to quantify internal stresses so that a comprehensive view of “ideal” storage and handling of valuable cultural artifacts, one that considers both chemical as well as structural integrity, can be realized. REFERENCESBerger, G. A., and W. H.Russell. 1986. Investigations into the reactions of plastic materials to environmental changes, I: The mechanics of decay of paint films. Studies in Conservation31:49–64. Berger, G. A., and W. H.Russell. 1988. An evaluation of the preparation of canvas paintings using stress measurements. Studies in Conservation33:187–204. Cook, R. D.1974. Concepts and applications of finite element analysis. New York: Wiley and Sons. 173–88. Eastman Kodak Co. 1985. Conservation of photographs. Publication No. F-40.. Hedley, G.1988. Relative humidity and the stress/strain response of canvas paintings: Uniaxial measurements of naturally aged samplesStudies in Conservation33:133–48. Higdon, A., E. H.Ohlsen, W. B.Stiles, and J. A.Weese. 1967. Mechanics of materials. New York: Wiley and Sons. 58–59. Karpowicz, A.1989. In-plane deformations of films of size on paintings in the glass transition region. Studies in Conservation34:67–74. Karpowicz, A.1990. A study on development of cracks on paintings. Journal of the American Institute for Conservation29:169–80. Mecklenburg, M. F.1982. Some aspects of the mechanical behavior of fabric-supported paintings. Report to the Smithsonian Institution. 12–15. Mecklenburg, M. F.1991. Some mechanical and physical properties of gilding gesso. In Gilded wood: Conservation and history, ed.D.Bigelow et al. Madison, Conn.: Sound View Press. 163–70. Mecklenburg, M. F., and C. S.Tumosa. 1991a. An introduction into the mechanical behavior of paintings under rapid loading conditions. In Art in transit, ed.M. F.Mecklenburg. Washington, D.C.: National Gallery of Art.137–72. Mecklenburg, M. F., and C. S.Tumosa. 1991b. Mechanical behavior of paintings subjected to changes in temperature and relative humidity. In Art in transit, ed.M. F.Mecklenburg. Washington, D.C.: National Gallery of Art.172–214. Mecklenburg, M. F., C. S.Tumosa, and M. H.McCormick-Goodhart. 1993. A general method for determining the mechanical properties needed for the computer analysis of polymeric structures subjected to changes in temperature and relative humidity. In Materials issues in art and archaeology, III, Materials Research Society Proceedings 283, ed.P. B.Vandiver, et al. 337–58. Michalski, S.1991. Paintings: Their response to temperature, relative humidity, shock, and vibration. In Art in transit, ed.M. F.Mecklenburg. Washington, D.C.: National Gallery of Art.223–48. Przemienicki, J. S.1968. Theory of matrix structural analysis. New York: McGraw-Hill. Sturge, J. M., V.Walworth, and A.Shepp, eds.1989. Imaging processes and materials, 8th ed.New York: Van Nostrand Reinhold. 129–30. AUTHOR INFORMATIONMARION F. MECKLENBURG has worked as a paintings conservator in the United States for 20 years. He holds B.S., M.S., and Ph.D. degrees in structural engineering from the University of Maryland. In 1987, he joined the Smithsonian Institution and is currently the assistant director of conservation research at the Conservation Analytical Laboratory. He is also a fellow in the Department of Materials Science, Johns Hopkins University, where he coordinates the joint CAL-JHU Ph.D. graduate program in materials science. His research areas are in the mechanics of materials and the effect of the environment on the mechanical properties of materials. Address: Conservation Analytical Laboratory, Smithsonian Institution, Washington, D. C. 20560. MARK H. McCORMICK-GOODHART joined the Smithsonian Institution in 1988 and is currently a research photographic scientist at the Conservation Analytical Laboratory. He holds a B.S. degree in photographic science from Rochester Institute of Technology. From 1976 to 1988 he was employed by Energy Conversion Devices, Inc., where he was granted eight U.S. patents related to nonsilver film and electronic imaging technology. His research interests concern the effects of environment on structural properties of photographs, and cold storage of photographic materials. Address: Same as for Mecklenburg. CHARLES S. TUMOSA is head of analytical services at the Conservation Analytical Laboratory and has been at the Smithsonian Institution for five years. He has a Ph.D. in chemistry from Virginia Polytechnic Institute and State University, Blacksburg, Virginia, research interests include the analysis of trace materials and the mechanical properties of materials. Address: Same as for Mecklenburg. Information and figures from Mecklenburg et al. 1993 have been reprinted by permission of the Materials Research Society.
 Section Index Section Index |