EXPOSURE OF ARTISTS' COLORANTS TO SULFUR DIOXIDEEDWIN L. WILLIAMS, ERIC GROSJEAN, & DANIEL GROSJEAN
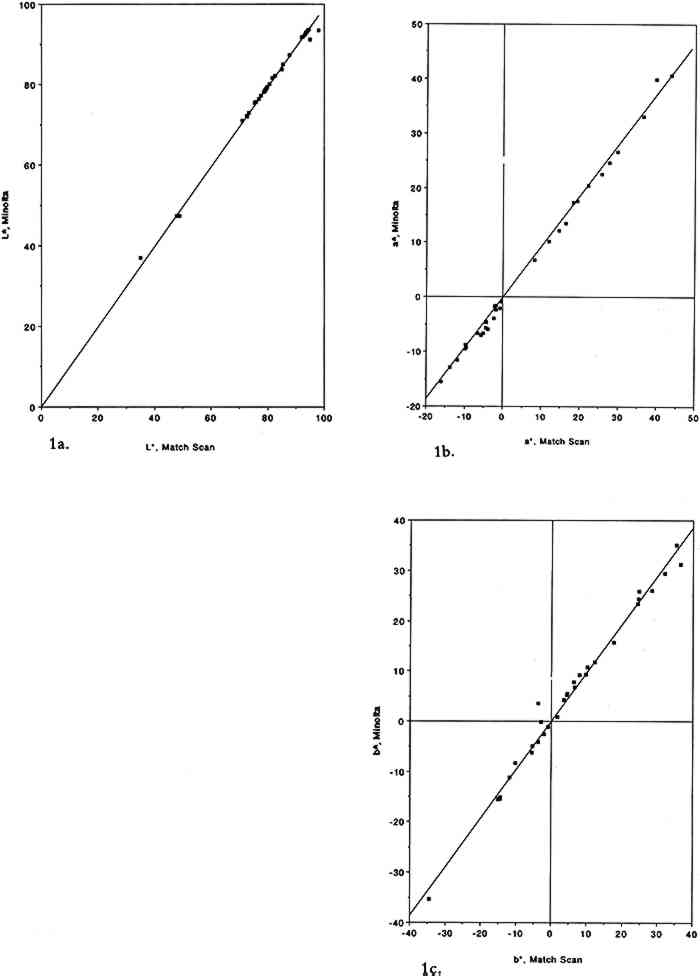
ABSTRACT—Thirty-four artists' colorants brushed on watercolor or cellulose paper have been exposed for 12 weeks to 93 � 5 parts per billion (ppb) of the air pollutant sulfur dioxide (SO2) in purified air. These exposures were carried out in the dark at ambient temperature and humidity. Color changes (L∗, a∗, b∗, and ΔE) were measured every week using a reflectance color analyzer. Color parameters (x, y, X, Y, Z, L∗, a∗, and b∗) were also calculated from the 380–700 nm spectra, recorded with a reflectance spectrophotometer, of unexposed colorants and of colorants exposed to SO2. Color changes measured by these two methods were in excellent agreement for both unexposed and SO2-exposed colorants (near-unity slopes, correlation coefficients >0.9).Exposure to sulfur dioxide resulted in little or no color change except for one category of colorants, the triphenylmethanes basic fuchsin, brilliant green, and pararosaniline base. A second exposure to higher levels of SO2 (920 � 30 ppb) for 2 weeks resulted in little additional color change, if any. A comparison is made of artists' colorant fading resulting from exposure to several air pollutants, including sulfur dioxide, ozone, nitrogen dioxide, nitric acid, formaldehyde, and peroxyacetyl nitrate. Implications for colorant-containing objects in museum collections are briefly discussed. 1 INTRODUCTIONStudies carried out in recent years have shown that several categories of artists' colorants fade, many of them substantially, when exposed in the dark to purified air containing parts per billion (ppb) levels of air pollutants. The air pollutants that have been studied to date include ozone (Shaver et al. 1983; Whitmore et al. 1987; Whitmore and Cass 1988), nitrogen dioxide (Whitmore and Cass 1989), nitric acid (Salmon et al. 1992; Grosjean et al. 1992), formaldehyde (Williams et al. 1992), and peroxyacetyl nitrate (CH3C(O)OONO2, hereafter PAN) (Williams et al. 1993). The selection of these pollutants for study of their possible impact on colorants in museum collections is based on their abundance in ambient and indoor air, including museums (Hisham and Grosjean 1991a, 1991b). Formaldehyde is ubiquitous in indoor air (U.S. National Academy of Sciences 1981), and museums worldwide are no exception (Hatchfield and Carpenter 1986; Grosjean et al. 1990). Ozone, nitrogen dioxide, nitric acid, and PAN are oxidants produced in photochemical smog and have been identified as major pollutants in many urban areas of the world that experience this type of air pollution, including Athens, Rome, Rio de Janeiro, Cairo, and Mexico City, (Nasralla and Shakour 1981; Lalas et al. 1987; Tanner et al. 1988; G�sten et al. 1988; Tsani-Bazaca et al. 1988; Grosjean et al. 1990). Several of these urban areas also have a substantial amount of cultural property. One major air pollutant, namely sulfur dioxide, has yet to be studied for its possible adverse effects on artists' colorants. With the exception of a few urban areas where In this article, we describe the methods and findings of an investigation focusing on color changes resulting from exposure of 34 artists' colorants to levels of sulfur dioxide that are relevant to museum air quality. The observed color changes are compared to those resulting from exposure of the same colorants to other major air pollutants and are discussed with respect to their implications for colorant-containing art objects in museum collections. 2 EXPERIMENTAL METHODS2.1 EXPOSURE CHAMBERThe colorants were exposed to purified air containing SO2 in a 45 l cube-shaped chamber constructed from six 0.63 cm thick sheets of polymethyl methacrylate. Five sides of the chamber were sealed permanently with acrylic cement, and the sixth (top) panel could be removed for periodic removal of colorant samples. A 2.9 cm wide collar coated with high-vacuum Teflon grease provided a leak-free seal between top and side panels. To minimize wall losses, the chamber was lined inside with clear Teflon film. Two small ports, inlet and exit, were located on opposite sides of the chamber. Additional details regarding the exposure chamber can be found elsewhere (Williams and Grosjean 1992). 2.2 EXPOSURE PROTOCOLPurified air was obtained by passing ambient air through large beds of activated carbon, silica gel, and Purafil (permanganate-coated alumina). These sorbent beds were followed by a glass fiber filter, which removed particulate matter, if any, downstream of the sorbent beds. The purified air thus obtained contained no detectable amounts of ozone, oxides of nitrogen, nitric acid, organic acids (formic and acetic acids), hydrogen sulfide, formaldehyde (0.46 � 0.42 ppb), acetaldehyde (0.97 � 0.79 ppb), or PAN (0.2 ppb). The concentration of SO2 in the purified air was less than our detection limit of 2.0 ppb. Two consecutive colorant exposures were carried out, one to 93 � 5 ppb SO2 for 12 weeks and the other to 920 � 30 ppb SO2 for 2 weeks. The exposures were carried out in the dark (chamber covered with sheets of opaque plastic) at room temperature Sulfur dioxide was measured by pulsed fluorescence using a continuous analyzer calibrated using a certified SO2 permeation tube according to U.S. Environmental Protection Agency-recommended calibration procedures. The instrument was connected to the matrix air lines upstream and downstream of the test chamber using Teflon tubing and three-way switch valves. The concentration of SO2 was generally monitored at the test chamber exit. Frequent checks were also made of the inlet concentration to verify the stability of the output of the SO2 permeation tube. With the exposure protocol described above, the concentrations of SO2 to which the colorants were exposed were reasonably constant. Weekly averaged SO2 concentrations are listed in table 1 along with the corresponding cumulative averages. Also listed in table 1 are the cumulative doses of SO2 to which the colorants were exposed (dose = product of SO2 concentration and exposure duration, units = ppb/week). Comparison of the test chamber inlet and exit SO2 concentrations indicated that on the average 32% of the inlet SO2 was removed by the colorant samples and the associated hardware. The empty chamber lined with Teflon film removed 12% of the inlet SO2 concentration. TABLE 1 SULFUR DIOXIDE CONCENTRATIONS AND DOSE OF SULFUR DIOXIDE TO WHICH THE ARTISTS' COLORANTS WERE EXPOSED To obtain an independent measure of the amount of SO2 to which the colorant samples were exposed, carbonate-coated filters housed in passive samplers (Hisham and Grosjean 1991b) were placed weekly in the test chamber and were analyzed for their SO2 content (as sulfate ion) by liquid chromatography with ultraviolet detection (Williams and Grosjean 1992). Three passive samplers were included each week during the first 5 weeks of the test. The 5-week-averaged SO2 concentration was 40 � 16 ppb, in reasonable agreement with the value of 51 � 20 ppb measured at the test chamber exit (see table 1). Sample exposure to SO2 was interrupted for about 2.5 hours at the end of the first week, second week, and so on, for color change readings. The cumulative duration of color change readings was 20 hours, or 1% of the total exposure duration, during which the samples were exposed to indoor light and to indoor laboratory air containing only low levels of air pollutants and levels of SO2, if any, that were below detection (≤ 2 ppb). Thus, these interruptions had little impact, if any, on the measured color changes. 2.3 COLORANTS AND SAMPLE PREPARATIONThe colorants studied including natural organic compounds (e.g., gamboge), modern organic colorants (including a number of Winsor and Newton watercolors), and inorganic pigments (e.g., Prussian blue, chrome yellow). These colorants were selected for consistency with those already studied for their fugitiveness to ozone, nitrogen dioxide, nitric acid, PAN, and formaldehyde. Most colorant samples were prepared by airbrushing dilute suspensions onto sheets of watercolor paper. To investigate possible substrate-specific effects, a few colorant samples were coated on Whatman 41 cellulose paper. The amount of colorant applied to watercolor paper was adjusted to obtain an initial reflectance of about 40% at the minimum reflectance wavelength. The colorant samples thus prepared were exposed to SO2 as 25 � 25 mm squares (watercolor paper) or 25 mm diameter discs (Whatman 41 paper). 2.4 COLOR MEASUREMENTSColor changes were measured by reflectance spectroscopy using two instruments, a Minolta color analyzer and a Bausch and Lomb reflectance spectrophotometer. The color analyzer was calibrated using a white reflector plate standard, and the light source standard was CIE illuminant C (CIE 1931 standard observer). The color analyzer's sample viewing area is 3 mm diameter. Additional calibration checks were carried out using a set of 12 standard ceramic color tiles (4 neutral grays and 8 chromatic standards) developed by the British Ceramic Research Association, Ltd., and calibrated at the National Physical Laboratory. The reflectance spectrophotometer was calibrated using a standard white tile referenced to an NBS standard. The spot size of the light beam was limited to 7 mm diameter using the small area view option. Calibration and reflectance spectra were all recorded with the specular beam excluded. Reflectance measurements were made at 2 nm intervals from 380 nm to 700 nm. Additional details regarding the measurement protocol have been previously reported (Whitmore et al. 1987; Whitmore and Cass 1989). Color changes can be reported using several color parameter systems including Using the color analyzer, the parameters L∗, a∗, b∗, and ΔE were measured after 1, 2, 3, 4, 6, 8, 10, 12, and 14 weeks of exposure. Using the spectrophotometer, the color parameters x, y, X, Y, Z, L∗, a∗, and b∗ were calculated from the reflectance spectra of the unexposed colorants and those of the same colorants after 14 weeks of exposure to SO2. Other color parameters could be readily calculated if so desired from these chromaticity coordinates and from the corresponding reflectance spectra. The reflectance spectra (plots and computer printouts) and color analyzer L∗ a∗ b∗ readings made after 1, 2, 3, etc., weeks of exposure (computerized spreadsheets) are not included in this article due to space limitations. 2.5 PRECISION AND ACCURACY OF COLOR MEASUREMENTSFor the ceramic standard tiles, the relative standard deviation (RSD, the standard deviation divided by the mean value) was 0–0.7% (L∗), 0–12.4% (a∗), and 0–22% (b∗) for triplicate measurements on all tiles using the color analyzer. The RSD was less than 2% except when the chromaticity parameters a∗ and/or b∗ were <1. For six sets of measurements on two tiles (red and cyan) with the spectrophotometer, the RSD was 0.1–0.6% (L∗), 0.7–0.9% (a∗), and 0.3–2.5% (b∗). For the colorant samples, the spectrophotometer's RSD for eight sets of replicates was 0–1.25% (L∗), 0.1–2.9% (a∗), and 0.1–3.3% (b∗). The color analyzer's RSD (sets of triplicate samples for all colorants studied) was typically 1–3% (see section 3 below). For the color analyzer, multiple measurements on single samples were all within 0.2 ΔE units for measurements carried out on the same day and were within 5–10% of the mean ΔE value for measurements carried out up to six months apart. Color parameters measured using the color analyzer and the spectrophotometer have been shown to be in good agreement for standard ceramic tiles. Linear regression analysis of the color parameters x, y, Y, L∗, a∗, and b∗ measured with the color analyzer and with the spectrophotometer versus the corresponding nominal values for the standard ceramic tiles yielded near-unity slopes and correlation coefficients >0.95 (Williams et al. 1991, 1992). The nominal values are those specified by the manufacturer for a “Master Set” of standard tiles. The good agreement between nominal and measured As is shown in figure 1, linear regression of the same color parameters for a set of 30 colorant samples (e.g., L∗, color analyzer versus L∗, spectrophotometer) also yielded near unity slopes and correlation coefficients of >0.99.
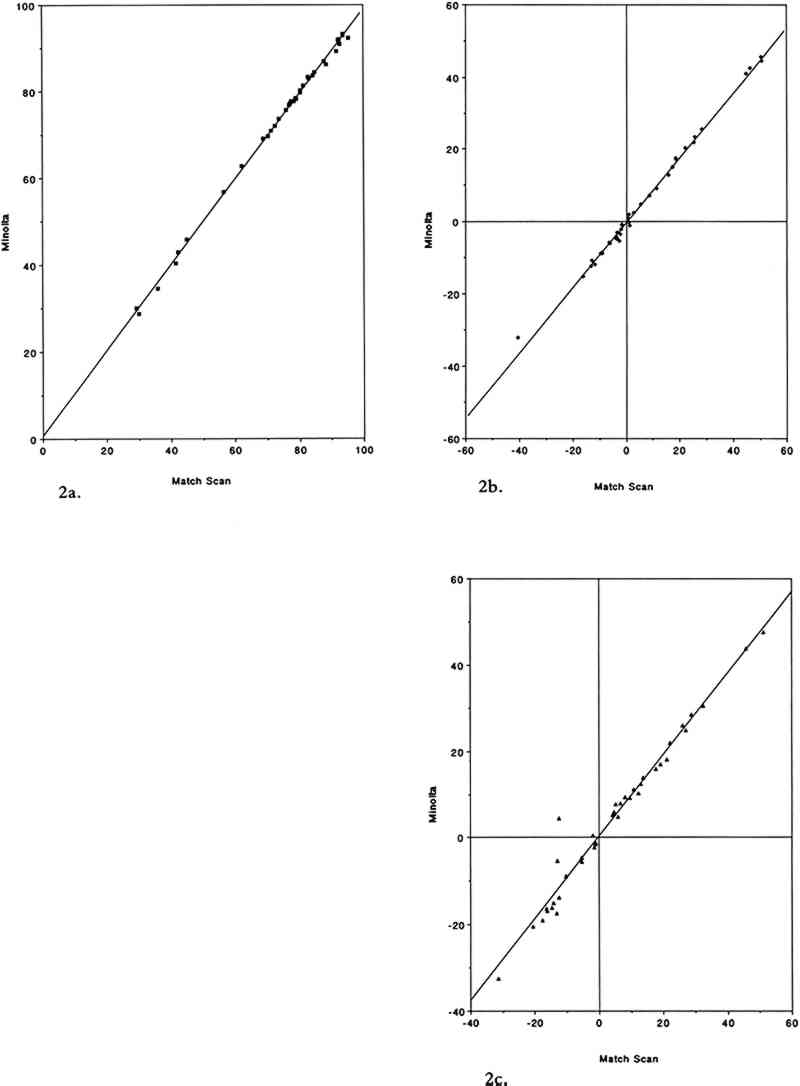
3 RESULTS AND DISCUSSION3.1 COMPARISON OF THE TWO COLOR MEASUREMENT METHODSAs mentioned in the experimental section, color parameters measured using the color analyzer and the spectrophotometer were in good agreement for standard ceramic color tiles and for unexposed colorant samples. This agreement holds true in the case of the colorant samples after exposure to SO2. Linear regression analysis of the color parameters L∗, a∗, and b∗ yielded near unity slopes and high correlation coefficients (table 2). The agreement between the two color measurement methods for SO2-exposed samples is illustrated in figure 2. TABLE 2 LEAST SQUARES LINEAR REGRESSION PARAMETERS FOR COLOR PARAMETERS L∗, a∗, AND b∗ MEASURED ON 40 SULFUR DIOXIDE-EXPOSED COLORANT SAMPLES USING THE COLOR ANALYZER AND THE REFLECTANCE SPECTROPHOTOMETER (a)
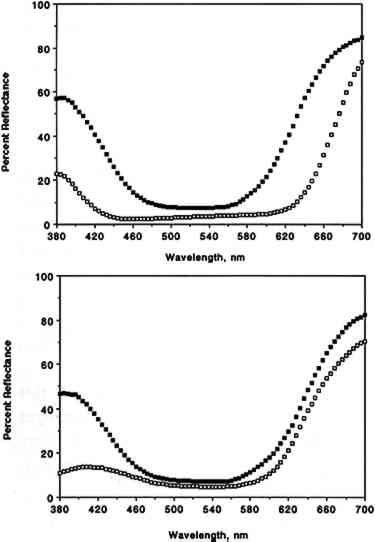
3.2 COLOR CHANGESIn this section, data discussed for colorants apply in fact to colorant “systems” (i.e., the combination of colorant, substrate, mode of application, and other parameters specified in the experimental section). Our results are summarized in table 3, which includes a list of the colorants studied, their origin, their chemical functionality (type of chromophore), the type of substrate employed for sample preparation, and the final color changes (ΔE, calculated from L∗, a∗, b∗ measured with the color analyzer) recorded after 12 weeks of exposure to SO2 in purified air. The corresponding L∗, a∗, b∗, and ΔE values measured after 1, 2, 3, 4, 6, 8, 10, 12, and 14 weeks of exposure are not included due to space limitations. The color parameters x, y, X, Y, Z, L∗, a∗, and b∗ calculated from the full 380–700 nm reflectance spectra recorded with the spectrophotometer are listed in table 4 for unexposed and SO2-exposed colorants. TABLE 3 COLOR CHANGE AFTER 12 WEEKS OF EXPOSURE TO SULFUR DIOXIDE TABLE 4 COLOR PARAMETERS CALCULATED FROM THE 380–700 nm SPECTRA OF UNEXPOSED AND EXPOSED COLORANT SAMPLES For most colorants studied, exposure to 93 � 5 ppb of SO2 for 12 weeks (equivalent to a total SO2 dose of 1,100 ppb/week) resulted in little or no color change. Thus, color changes after 12 weeks of exposure were ΔE ≤1 for 12 colorants, 1 < ΔE ≤2 for 13 colorants, and 2 <Δ E ≤3 for 5 colorants. Within experimental precision, the small color changes measured for those colorants that were not SO2-fugitive (ΔE ≤ 2) were essentially the same (within one standard deviation) as those observed earlier upon exposure for 12 weeks to purified air alone (Williams et al. 1992). Thus for many of these colorants the small color changes observed may in fact be due to air oxidation rather than to reaction with SO2. The most SO2-fugitive colorants (4 < ΔE < 8) included the three triphenylmethane colorants tested, namely basic fuchsin, brilliant green, and pararosaniline base, and possibly one inorganic colorant, chrome yellow (lead chromate). For chrome yellow, the large uncertainty in the measured color change (ΔE = 4.4 � 4.0) reflected nonuniform deposit on Whatman 41 paper, due in part to the limited solubility of the colorant in the coating solvents tested. The reflectance spectra of basic fuchsin and pararosaniline base before and after exposure to SO2 are shown in figure 3. For both colorants, exposure to SO2 results in a substantial change in reflectance in the 380–440 and 600–700 nm regions of the spectrum. For basic fuchsin, the largest change was in
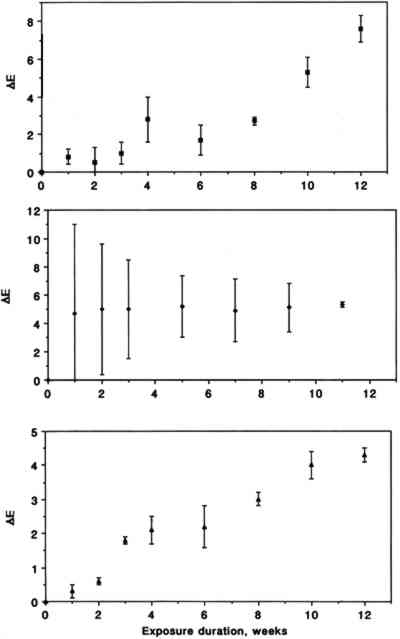
Color changes as a function of exposure duration are shown in figure 4 for the three triphenylmethane colorants. Exposure to SO2 resulted in a gradual fading for pararosaniline base and for basic fuchsin. The trend for brilliant green is less obvious due to substantial scatter of the data in the early part of the experiment. The relative contributions of changes in L∗, a∗, and b∗ to the measured ΔE were 21.6 � 15.3, 40.2 � 31.4, and 38.2 � 46.7%, respectively, for chrome yellow, 8.2 � 0.8, 53.4 � 2.9, and 38.4 � 2.2 % for basic fuchsin, 21.5 � 18.5, 5.0 � 2.1, and 73.6 � 18.2% for brilliant green, and 0.8 � 1.2, 73.1 � 13.0, and 26.1 � 12.3% for pararosaniline base.
3.3 SECOND EXPOSURE TO A HIGHER CONCENTRATION OF SO2After exposure to 93 � 5 ppb SO2 for 12 weeks, the same colorant samples were re-exposed for 2 weeks to a higher concentration A possible explanation for these results is that fading of the colorant-paper system by SO2 is more dependent on the colorant-pollutant contact time (including mass transfer of SO2 and subsequent chemical reaction) than on the SO2 concentration. While no attempt was made to study this effect in a more systematic fashion, our results suggest that a single, short-term test (“accelerated aging”) carried out at high levels of SO2 would have led to a severe underestimate of the actual effect of SO2 on the triphenylmethane colorants tested. TABLE 5 COMPARISON OF COLOR CHANGES IN TWO CONSECUTIVE COLORANT EXPOSURES TO SULFUR DIOXIDE 3.4 COMPARISON WITH OTHER AIR POLLUTANTSAlso of interest in the context of this study is a comparison of color changes resulting from exposure to SO2 to those resulting from exposure to other air pollutants TABLE 6 COMPARISON OF COLOR CHANGE RESULTING FROM EXPOSURE OF COLORANTS ON WATERCOLOR PAPER TO SULFUR DIOXIDE, PEROXYACETYL NITRATE, OZONE, NITROGEN DIOXIDE, FORMALDEHYDE, NITRIC ACID, AND PURIFIED AIR FOR 12 WEEKS The potential for damage to colorants in museum collections is a function of the pollutant concentration, the exposure duration, and the magnitude of the specific pollutant-colorant interaction (i.e., fading or color change). Since the pollutants listed above may be present in museum air at comparable levels, ozone appears to be of greater concern than SO2 with respect to damage to colorant-containing art objects by virtue of its ability to react with a greater diversity of colorant chemical functionalities (unsaturated natural colorants, alizarin derivatives, etc). 3.5 IMPLICATIONS FOR MUSEUM COLLECTIONSOf the several chemical functionalities tested (inorganic colorants, natural organic colorants, and synthetic colorants including arylamides, azo dyes, amino-substituted anthraquinones, and alizarin lakes), only one, the triphenylmethane colorants, was found to be SO2-fugitive under the conditions tested. Since fugitiveness may be closely correlated with colorant chemical functionality, as we have observed in earlier work with ozone (Grosjean et al., 1987, 1988a, 1988b, 1989), this conclusion can probably extended to many other colorants that are structural homologues of those included in this study. Concentrations of SO2 recorded in museum air range from less than 1 ppb (Hisham and Grosjean 1991b) to 40–50 ppb (Hackney 1984; Brimblecombe 1990). In museums that lack heating, ventilation, and air conditioning (HVAC) systems, museums equipped with HVAC without chemical filtration, or museums equipped with HVAC-chemical filtration systems that are not properly serviced, indoor levels of SO2 of about 50 ppb may not be uncommon (especially if outdoor levels of SO2 are high and/or indoor sources of SO2 are present, e.g., space heating). In these museums, it would take only 4–6 months for objects to be exposed to the same dose of SO2 as the one to which artists' colorants were exposed in this study. On the other hand, the airborne SO2 concentration may be as low as 1 ppb in a museum equipped with a well-maintained HVAC-chemical filtration system, located in an urban area where outdoor levels of SO2 are low (Hisham and Grosjean 1991b) and without indoor sources of SO2. In this case, it would take about 15 years for art objects to be subjected to the same dose of SO2 as the one we employed in this study. The limitations of our study with respect to conservation practice are as follows. First, while all but one category of the colorants tested were not SO2-fugitive, objects ACKNOWLEDGEMENTSWe thank Glen R. Cass, California Institute of Technology, Pasadena, California, for permission to use the spectrophotometer. Denise Velez prepared the draft and final versions of the manuscript. REFERENCESBaer, N. S., and P. N.Banks. 1985. Indoor pollution effect on cultural and historical materials. International Journal of Museum Management and Curatorship4:9–20. Beloin, N. J.1973. Fading of dyed fabrics exposed to air pollutants. Textile Chemist and Colorist5:128–33. Bennett, B. G., J. G.Kretzchmar, G. G.Akland, and H. W.de Koning. 1985. Urban air pollution worldwide. Environmental Science and Technology19:298–304. Brimblecombe, P.1990. The composition of museum atmospheres. Atmospheric Environment24B:1–8. De Koning, H. W., J. G.Kretzschmar, G. G.Akland, and B. G.Bennett. 1986. Air pollution in different cities around the world. Atmospheric Environment20:101–14. Eastlake, C. T., M.Faraday, and W.Russell. 1850. Report on protection by glass of the pictures in the National Gallery. House of Commons, London, May 24. Economopoulos, A. P.1987. Development of the five year air pollution abatement plan for the greater Athens area. Journal of Air Pollution Control Association37:889–97. Ember, L. R.1990. Pollution chokes East-bloc nations. Chemical Engineering News April 16, 7–16. Fassina, V.1978. A survey of air pollution and deterioration of stonework in Venice. Atmospheric Environment12:2205–11. Grosjean, D., A. H.Miguel, and T. M.Tavares. 1990. Urban air pollution in Brazil: Acetaldehyde and other carbonyls. Atmospheric Environment24B:101–6. Grosjean, D., and S. S.Parmar. 1991. Removal of air pollutant mixtures from museum display cases. Studies in Conservation36:129–41. Grosjean, D., L.Salmon, and G. R.Cass. 1992. Fading of artists' colorants by atmospheric nitric acid: Reaction products and mechanisms. Environmental Science and Technology26:952–59. Grosjean, D., P. M.Whitmore, G. R.Cass, and J. R.Druzik. 1988a. Ozone fading of natural organic colorants: Mechanisms and products of the reaction of ozone with indigos. Environmental Science and Technology22:292–98.
Grosjean, D., P. M.Whitmore, G. R.Cass, and J. R.Druzik. 1989. Ozone fading of triphenylmethane colorants: Reaction products and Grosjean, D., P. M.Whitmore, C. P.DeMoor, G. R.Cass, and J. R.Druzik. 1987. Fading of alizarin and related artists' pigments by atmospheric ozone: Reaction products and mechanisms. Environmental Science and Technology21:635–43. Grosjean, D., P. M.Whitmore, C. P.DeMoor, G. R.Cass, and J. R.Druzik. 1988b. Ozone fading of organic colorants: Products and mechanisms of the reaction of ozone with curcumin. Environmental Science and Technology22:1357–61. G�sten, H., G.Heinrich, T.Cvitas, L.Klasinc, B.Ruscic, D. P.Lalas, and M.Petrakis. 1988. Photochemical formation and transport of ozone in Athens, Greece. Atmospheric Environment22:1855–61. Hackney, S.1984. The distribution of gaseous air pollution within museums. Studies in Conservation29:105–16. Hatchfield, P. B., and J. M.Carpenter. 1986. The problem of formaldehyde in museum collections. International Journal of Museum Management and Curatorship5:183–88. Hemphill, J. E., J. E.Norton, O. A.Ofjor, and R. L.Stone. 1976. Color fastness to light and atmospheric contaminants. Textile Chemist and Colorist8:60–62. Hisham, M.W.M., and D.Grosjean. 1991a. Air pollution in southern California museums: Indoor and outdoor levels of nitrogen dioxide, peroxyacetyl nitrate, nitric acid, and chlorinated hydrocarbons. Environmental Science and Technology25:857–62. Hisham, M.W.M., and D.Grosjean. 1991b. Sulfur dioxide, hydrogen sulfide, total reduced sulfur, chlorinated hydrocarbons, and photochemical oxidants in southern California museums. Atmospheric Environment25A:1497–1505. Lal Gauri, K., and G. C.Holdren, Jr.1981. Pollutant effects on stone monuments. Environmental Science and Technology15:386–90. Lalas, D. P., M.Tombrou-Tsella, M.Petrakis, D. N.Asimako-poulos, and C.Helmis. 1987. An experimental study of the horizontal and vertical distribution of ozone over Athens. Atmospheric Environment21:2681–93. Nasralla, M. M., and A. A.Shakour. 1981. Nitrogen oxides and photochemical oxidants in Cairo atmosphere. Environment International5:55–60. Parmar, S. S., and D.Grosjean. 1991. Sorbent removal of air pollutants from museum display cases. Environment International7:39–50. Salmon, L. G., G. R.Cass, D.Grosjean, M. C.Jones, M. P.Ligocki, and W. W.Nazaroff. 1992. Protection of works of art from atmospheric nitric acid. Final report to the Getty Conservation Institute, Environmental Quality Laboratory, California Institute of Technology, Pasadena, Calif., May. Shaver, C. L., G. R.Cass, and J. R.Druzik. 1983. Ozone and the deterioration of works of art. Environmental Science and Technology17:748–52. Tanner, R. L., A. H.Miguel, J. B.de Andrade, J. S.Gaffney, and G. E.Strait. 1988. Atmospheric chemistry of aldehydes: Enhanced peroxyacetyl nitrate formation from ethanol-fueled vehicular emissions. Environmental Science and Technology22:1026–34. Thompson, G.1978. The museum environment. London: Butterworths. Tsani-Bazaca, E., S.Glavas, and H.G�sten. 1988. Peroxyacetyl nitrate (PAN) concentrations in Athens, Greece. Atmospheric Environment22:2283–86.
U.S. National Academy of Sciences. 1981. Formaldehyde and other aldehydes. Washington, D.C.: Board on Toxicology and Environmental Health Hazards, National Academy Press. Veldt, C.1991. Emissions of SOx, NOx, VOC and CO from East European countries. Atmospheric Environment25A:2683–2700. Whitmore, P. M., and G. R.Cass. 1988. The ozone fading of traditional Japanese colorants. Studies in Conservation33:29–40. Whitmore, P. M., and G. R.Cass. 1989. The fading of artists' colorants by exposure to atmospheric nitrogen dioxide. Studies in Conservation34:85–97. Whitmore, P. M., G. R.Cass, and J. R.Druzik. 1987. The ozone fading of traditional natural organic colorants on paper. Journal of the American Institute for Conservation26:45–58. Williams, E. L., II, and D.Grosjean. 1992. Exposure of deacidified and untreated paper to ambient levels of sulfur dioxide and nitrogen dioxide: Nature and yields of reaction products. Journal of the American Institute for Conservation31:199–212. Williams, E. L., II, E.Grosjean, and D.Grosjean. 1991. Exposure of artists' colorants to air pollutants: Reflectance spectra of exposed and unexposed samples. Final report to the Getty Conservation Institute, DGA, Inc., Ventura, Calif., October. Williams, E. L., II, E.Grosjean, and D.Grosjean. 1992. Exposure of artists' colorants to airborne formaldehyde. Studies in Conservation37:201–10. Williams, E. L., II, E.Grosjean, and D.Grosjean. 1993. Exposure of artists' colorants to peroxyacetyl nitrate. Journal of the American Institute for Conservation32:59–79. Zhao, D., J.Xiong, Y.Xu, and W. H.Chen. 1988. Acid rain in southwestern China. Atmospheric Environment22:349–58. SOURCES OF MATERIALSActivated carbon (type BPL, 6-16 mesh)Calgon Corp., Pittsburgh, Pa. FEP Teflon film (type 200A)DuPont, Wilmington, Del. Glass fiber filterWhatman Lab Sales, Hillsboro, Oreg. High vacuum Teflon greaseBaxter Scientific Products, Irvine, Calif. Plexiglas (Acrylite FF)Gem-O-Lite Company, Ventura, Calif. PurafilPurafil, Inc., Atlanta, Ga. Reflectance color analyzer, Chroma-Meter, model CR-121Minolta Corp., Ramsey, N. J. Reflectance spectrophotometer, Diano Match, Scan II,Bausch and Lomb, Woburn, Mass. Silica gel (3–8 mesh)Aldrich Chemical Co., Milwaukee, Wis. Standard ceramic color tilesBritish Ceramic Research Associates, Ltd., Stoke-on-Trent, England Sulfur dioxide permeation tubeVICI Metronics, Santa Clara, Calif. Sulfur dioxide continuous analyzer Model 8850 pulsed fluorescence SO2 analyzersMonitor Labs, San Diego, Calif. Watercolor paper, 100% rag fiber, 140 lbs, neutral pH, hot-pressedPerrigot, Arches, France Weld-on (acrylic plastic cement)Gem-O-Lite Company, Ventura, Calif. Whatman 41 cellulose filtersWhatman Lab Sales, Hillsboro, Oreg. AUTHOR INFORMATIONEDWIN L. WILLIAMS II holds an M.S. degree in physical chemistry from the University of California, Los Angeles (1986) and is a research scientist with DGA, Inc. He is involved in research projects including atmospheric chemistry, air pollution measurements, development and application of new analytical methods for the determination of trace levels of air pollutants, museum air quality, and studies of the impact of air pollutants on paper and on artists' colorants. Address: DGA, Inc., 4526 Telephone Rd., Suite 205, Ventura, Calif. 93003. ERIC GROSJEAN holds a B.A. degree in environmental sciences from the California State University, Northridge (1991) and is a research assistant at DGA, Inc. He is involved in research projects including laboratory studies of atmospheric chemical reactions, air pollution measurements in urban air, indoor air quality, and studies of the impact of air pollutants on artists' colorants. Address: DGA, Inc., 4526 Telephone Rd., Suite 205, Ventura, Calif. 93003. DANIEL GROSJEAN holds a docteur es sciences degree in physical organic chemistry from the University of Paris (1972) and did postdoctoral research at the Department of Environmental Health Engineering, California Institute of Technology, Pasadena. He is president of DGA, Inc., a private environmental research company that he founded in 1983, and directs research studies in atmospheric chemistry, air pollution measurements, museum air quality, and art conservation. He is a visiting associate, Department of Chemical Engineering, California Institute of Technology, Pasadena. His recent work in the field of art conservation has included several surveys of air quality in museums, the design of mitigation measures such as the use of sorbents to remove air pollutants from display cases, the development of passive samplers for measuring formaldehyde and other pollutants in museum air, and studies of the impact of air pollutants on deacidified paper, artists' colorants, and other materials relevant to museum collections. Address: DGA, Inc., 4526 Telephone Rd., Suite 205, Ventura, Calif. 93003.
 Section Index Section Index |