FURNITURE FINISH LAYER IDENTIFICATION BY INFRARED LINEAR MAPPING MICROSPECTROSCOPYMICHELE R. DERRICK, DUSAN C. STULIK, JAMES M. LANDRY, & STEVEN P. BOUFFARD
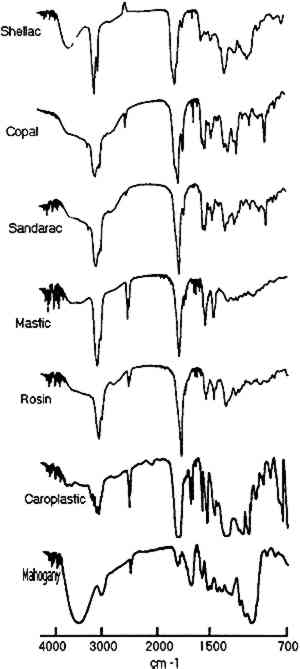
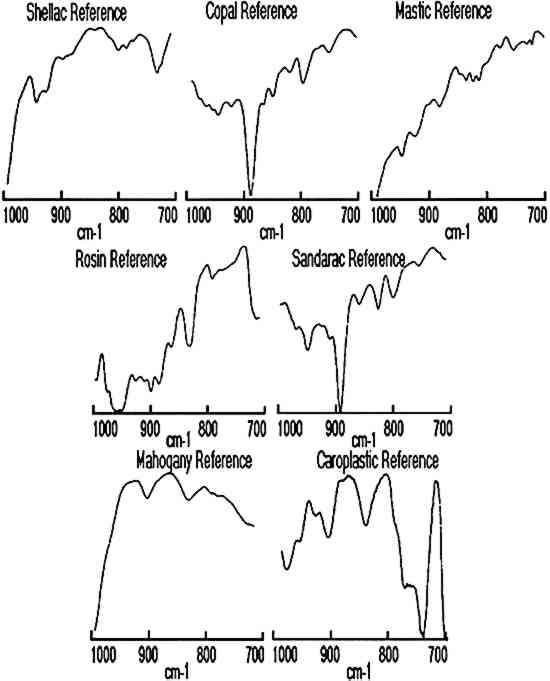
3 RESULTS AND DISCUSSIONNumerous facsimile cross sections were analyzed to determine the optimum methods for embedding, microtoming, and analysis. The results of two of these test samples are presented below to describe the linear mapping method used for identification of the layers as well as for estimation of their size. The results for four furniture finish samples are then presented along with the advantages and limitations of the technique. Infrared spectra were collected for each step of the linear mapping experiments from 4000–700 cm−1, but the region from 1000–700 cm−1 proved most convenient for characterization of the layers. Reference spectra of each resin as well as of the mahogany support and polyester resin embedding medium are shown in figures 1 and 2 for the wavenumber ranges of 4000–700 cm−1and 1000– 700 cm−1, respectively.
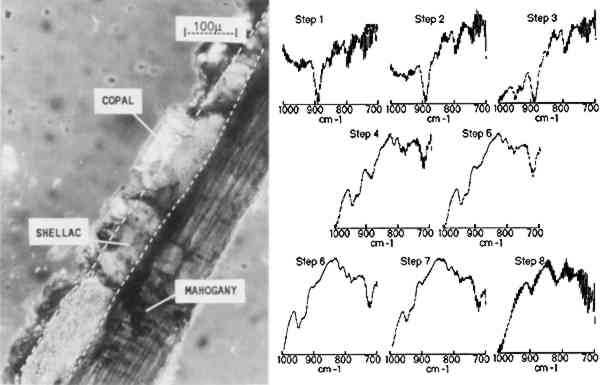
3.1 MULTILAYER SAMPLE ON MAHOGANY VENEERA photomicrograph of one cross section of a facsimile binary-layer resin sample, made by coating a mahogany surface with three coats of shellac followed by two coats of copal, is shown in figure 3. The infrared linear mapping experiment
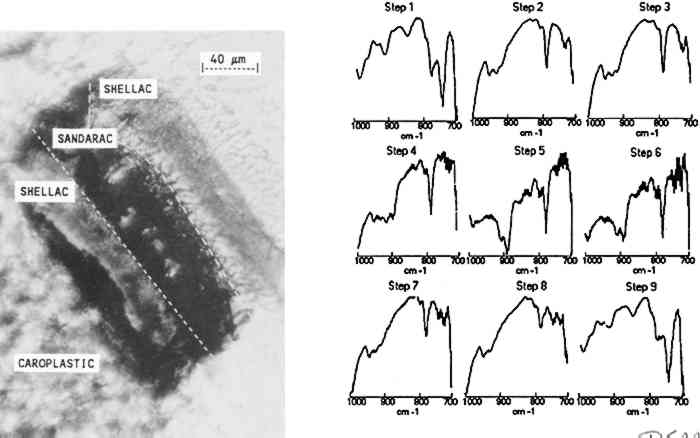
The results indicate that the transition from the copal to the shellac layer occurs in the area sampled by steps 3–4. The boundary between the layers is not expected to be sharp because is not necessarily uniform in its linearity across the sample and because the size of the aperture in the dimension perpendicular to the linear mapping axis is relatively large (400 μm). The size or thickness of each layer in the sample can be estimated by using the evidence supplied by relative intensities of the pertinent 3.2 MULTILAYER SAMPLES IN EMBEDDING MEDIASmall or fragile samples need the additional support of an embedding media before they can be microtomed. Five types of embedding media (wax, epoxy, acrylic, silicone, and polyester) were tested for their ease of sample preparation, clarity, and microtoming qualities. Epoxies were not selected because many of them required elevated temperatures to cure in a reasonable amount of time and because most were very difficult to microtome. Acrylics were undesirable because of their high solvent content and tendency to shrink 10–20% on curing. When cured, the silicones tested were not rigid enough to microtome. Test samples were embedded and microtomed successfully in the wax and polyester resin. While the paraffin worked as an embedding medium, it was not ideal due to its opacity. The polyesters (Bioplastic and Caroplastic) were selected for the embedding of the furniture finish samples because they cut One example of a test case using the polyester embedding medium was a cross section taken from a sample made by applying three coats of shellac on a Teflon surface followed by three coats of sandarac and three coats of shellac. The photomicrograph of this three-layered cross section is shown in figure 4 with the surrounding polyester embedding medium. Also shown is the sequence of IR spectra (1000–700 cm−1) obtained using 20 μm linear mapping steps of a 20 � 400 μm window. The spectra obtained at steps 1 and 9, which correspond to the outer edges of the sample, show a strong band at 735 cm−1 characteristic of the Caroplastic embedding medium. Spectra from steps 2 and 3 show the characteristic shellac bands at 945, 930, and 724 cm−1. The spectrum from step 4, collected at the interface of the shellac (outer) and sandarac layers, is a summation of absorbances due to both resins, which indicates the presence of both in the area sampled. The bands characteristic of sandarac, seen at 910 and 890 cm−1, predominate in the spectra for steps 5 and 6. The second shellac layer is apparent in the spectra of steps 7 and 8, which again show the characteristic bands for shellac at 945, 930, and 724 cm−1. Based on the infrared spectra, the size of the layers was estimated to be 50, 45, and 45 μm for the shellac (outer), sandarac, and shellac (inner) layers, respectively. These sizes correspond well with the measurement of these layers using an optical microscope.
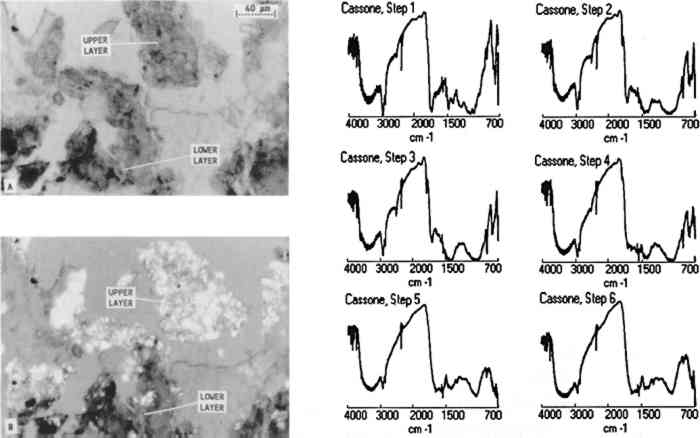
3.3 FURNITURE FINISH SAMPLES EMBEDDED IN POLYESTEROne furniture finish sample was taken from a 16th-century Italian cassone at the J. Paul Getty Museum (68.D.8) from near an insect-damaged area on the side. The photomicrograph of the cross section (A in fig. 5) shows that the sample clearly contains two layers. Examination of the sample between crossed polars (B in fig. 5) reveals that the sample contains a high proportion of inorganic materials, which could cause the atypical, crumbly characteristics of the microtomed slice. All other samples in this study were very cohesive and sliced nicely. Infrared spectra collected from the microtomed cross section (fig. 5) show that the lower layer contains glue and calcium carbonate (steps 5 and 6) while the upper layer contains shellac, calcium carbonate, and calcium sulfate (steps 2, 3, and 4). The glue layer may represent a fill or an old preparation layer since many of the chests were gilded. To determine whether these two layers exist on other areas of the cassone, another sample will be analyzed from a nondamaged area. As in all analytical methods, it is important to analyze several samples before making any projection about the overall composition of a finish.
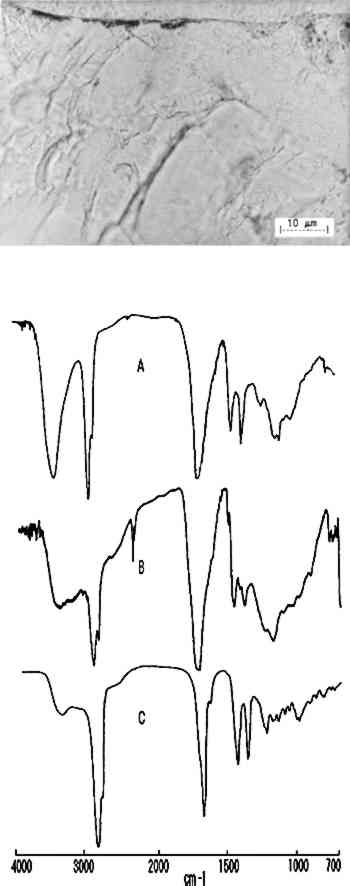
The next sample came from the back of the seat rail on a Duncan Phyfe caned-back sofa (New York, ca. 1815, U.S. Department of State Collection, L80.079). The photomicrograph of the sample (fig. 6), shows that it appears to contain a clear finish with a darkened area on the surface. The darkened area was very brittle and hard to microtome. The infrared analysis (B. in fig. 6, spectrum from step 4) produced similar spectra in all steps, indicating that the entire finish was mastic or dammar resin. The spectrum obtained from the darkened surface area produced only minor variations that could not be definitely attributed since the proximity of the embedding media to the surface causes spectral interferences.
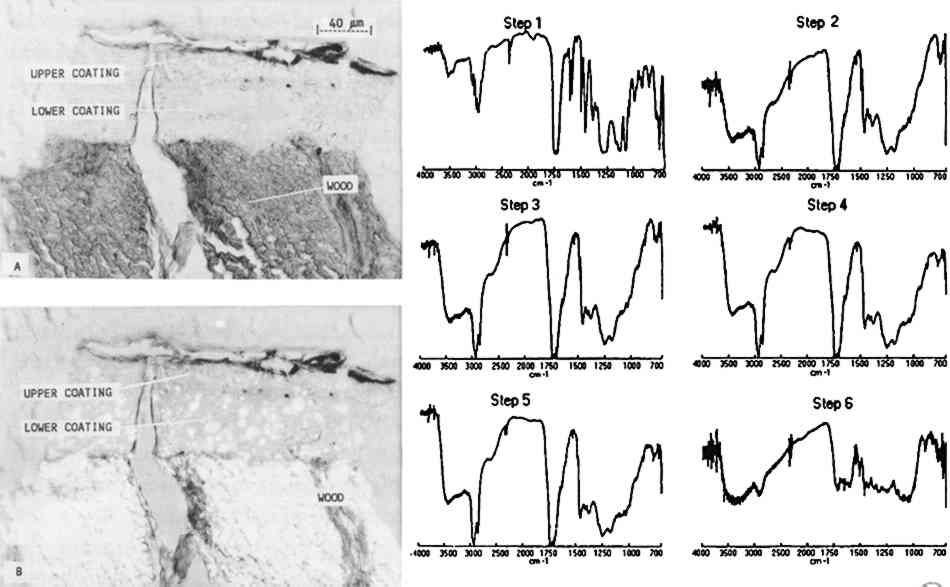
Some infiltration of the polyester medium into freshly prepared mastic layers was noted on the facsimiles. However, only minimal indications of infiltration were observed on the sample A photomicrograph of a microtomed cross section taken from a Paris Peace Treaty desk (British, ca. 1780, U.S. Department of State Collection, 64.010) is presented in figure 7. Through an optical microscope with normal (A) and polarized (B) transmitted light, the thin section appeared to have three distinct layers: wood, a lower coating layer, and an upper coating layer with a dirty surface. Infrared analysis of the sample, however, indicated that the entire coating was shellac. The full infrared spectra, 4000–700 cm−1, show the transition from the embedding media in step 1 (Caroplastic) to the wood in step 6. The coating on the wood, represented by steps 2–5, corresponds to shellac. There are some minor differences in the step 2 spectrum obtained from the outer surface of the coating. The sharp bands at 3010 and 1500 cm−1, along with the change in the band at 1460 cm−1, are due to the Caroplastic. Other small spectral changes may be due to a thin layer of dirt, oil, or wax or to surface oxidation, but none of these possible causes can be determined clearly from the spectra.
Previous analysis of the top surface of a German rolltop desk by David Roentgen (ca. 1785, J. Paul Getty Museum, 72.DA.47) had shown that the sample contained shellac, cellulose nitrate, and wax. But since this sample had been removed by scraping a small amount of |