FURNITURE FINISH LAYER IDENTIFICATION BY INFRARED LINEAR MAPPING MICROSPECTROSCOPYMICHELE R. DERRICK, DUSAN C. STULIK, JAMES M. LANDRY, & STEVEN P. BOUFFARD
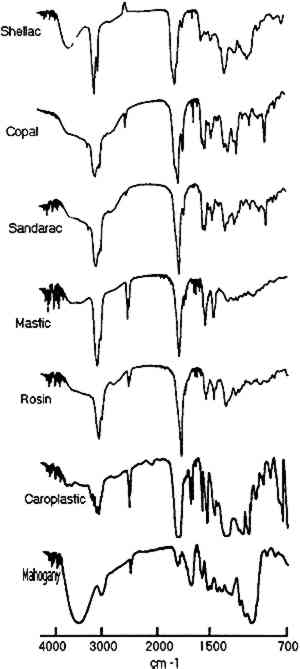
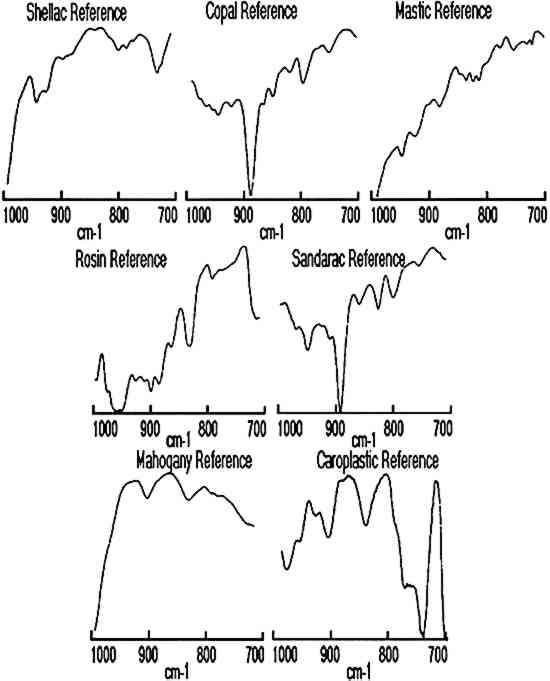
ABSTRACT—Infrared linear mapping microspectroscopy is a new technique that can provide information about the composition, position, and size of individual layers in a multilayered sample. Resin coating samples from multilayered facsimiles as well as cross sections of finishes taken from historical furniture were microtomed with and without the use of embedding media. A linear mapping routine was then used to systematically collect infrared spectra from each microtomed sample by sequentially moving the sample in 20 μm steps under an aperture of 20 � 400 μm. The resulting spectra were used for identification of components in individual layers on the samples. The advantages and limitations of the analysis technique are discussed using finish samples taken from 16th-, 18th-, and 19th-century furniture. 1 INTRODUCTIONIdentification of resins used for furniture finishes is important for art historical analysis of an artifact as well as for an initial material survey in restoration or conservation treatments. A detailed chemical analysis of surface finishes can also provide important information on previous surface treatment procedures and techniques. The materials and techniques for furniture surface treatment have, for the most part, been developed empirically throughout the ages. The craft was industrialized in the second half of the 19th century, yet many craft procedures were retained until the beginning of the 20th century. Collections of old recipes provide some insight into the chemistry of varnishes used for furniture surface treatment (Brachert 1978; Mussey 1982; Penn 1984). However, the natural resins used to a great extent for these surface finishes are very difficult to analyze due to their complex composition, natural variability, and susceptibility to polymerization and oxidation. A review of the chemistry of natural resins important for research in art and archaeology was published by Mills and White (1977). The analytical methods used for natural resin identification were reviewed several years ago by Masschelein-Kleiner (1986). While simple tests can provide some information on whether resins are present, there are primarily two instrumental techniques—gas chromatography and infrared spectroscopy—that can provide detailed characterizations of resins. Gas chromatography and gas chromatography mass spectrometry are widely used for the identification of resin types and quantities and are particularly useful for mixtures of components. Infrared analysis can identify a broad range of components that may exist in the sample without using any derivitization procedures. The advantages of infrared spectroscopy for the analysis of varnishes and surface finishes was recognized relatively early (Feller 1954, 1958). Since then, infrared spectroscopy has found a widespread application in art conservation laboratories and laboratories that deal with analysis of natural resins (Thomson 1963; Bruun and Sjoholm 1964; Soteland and Elletsen 1964; von Jayme and Traser 1969; Low and Baer The standard infrared (IR) analysis method requires that the sample be scraped from the surface and mixed thoroughly with KBr. This procedure can result in a misrepresentation of any stratigraphy in the surface finish. In evaluating the role of infrared spectroscopy in identification of natural resins, Masschelein-Kleiner (1986) wrote: “The method [IR] needs previous purification of the sample to ensure as far as possible that only one layer [of varnish] has been taken.” It is difficult to remove just one layer because some varnish layers are very thin and some surface finishes represent complex multilayer structures. However, the recent advance of infrared microspectroscopy allows for analysis of small sample areas through the coupling of an infrared microscope to an FTIR spectrometer. A method is described in this paper for the analysis of multilayer structures of surface finishes using infrared microspectroscopy to identify individual varnish layers in a cross section. This technique has been applied to many other types of samples ranging from multilayer paintings (Derrick et al. 1990; Landry et al. 1990) to deteriorated parchment (Derrick 1990). 2 EXPERIMENTALResins commonly used in the historic varnish recipes listed by (Brachert 1978, 1979) were selected for this study. They included an insect resin (shellac) as well as diterpenoid (copal, sandarac, and rosin) and triterpenoid (mastic) tree resins. Resin varnishes on furniture were typically either applied as spirit varnishes (resin-solvent mixture) or oil varnishes (resin-oil-solvent mixture). Only spirit varnishes will be discussed in this paper. Solutions of the resins in ethanol (40 % w/v) were prepared to represent typical spirit varnish formulations (McGiffin 1983; Allen 1984). These solutions were used to make facsimile samples by brushing the varnish on mahogany veneer, Teflon, or polyethylene surfaces. Multiple layers, each containing a single resin component, were applied to each sample. Each layer was allowed to dry for several days before a new layer was added. For the first set of samples, portions of the veneer-resin composite (e.g., 2 � 5 mm) were removed from the plywood support using a razor blade. The resultant sample cross section was of sufficient strength and size to allow for direct mounting and slicing on a Reichert-Jung Model 2040 Autocut microtome with a stainless steel blade. The samples were cut to produce 15–25 μm thin-section slices of the layered cross section. The second method of cross-section preparation involved removing smaller portions (e.g., 1 � 3 mm) of a multilayer resin coat from either the Teflon or the polyethylene support. This sample was then embedded in a polyester resin (sold under the trade names of Bioplastic or Caroplastic). Once the mold was cured (≈ 24 hours), most of the excess plastic around the sample was trimmed away to minimize the contact area for slicing. Using this procedure, samples were routinely microtomed to give 5–15 μm thin-section slices. All samples of finishes obtained from museum objects (e.g., 0.5 � 1 mm) were embedded in polyester resin and then microtomed in this manner. Once microtomed, the thin-section slices were placed on a BaF2 window and transferred to the sample stage of the infrared microscope for analysis. The infrared microscope used in this study was the Spectra-Tech IR-Plan II research 3 RESULTS AND DISCUSSIONNumerous facsimile cross sections were analyzed to determine the optimum methods for embedding, microtoming, and analysis. The results of two of these test samples are presented below to describe the linear mapping method used for identification of the layers as well as for estimation of their size. The results for four furniture finish samples are then presented along with the advantages and limitations of the technique. Infrared spectra were collected for each step of the linear mapping experiments from 4000–700 cm−1, but the region from 1000–700 cm−1 proved most convenient for characterization of the layers. Reference spectra of each resin as well as of the mahogany support and polyester resin embedding medium are shown in figures 1 and 2 for the wavenumber ranges of 4000–700 cm−1and 1000– 700 cm−1, respectively.
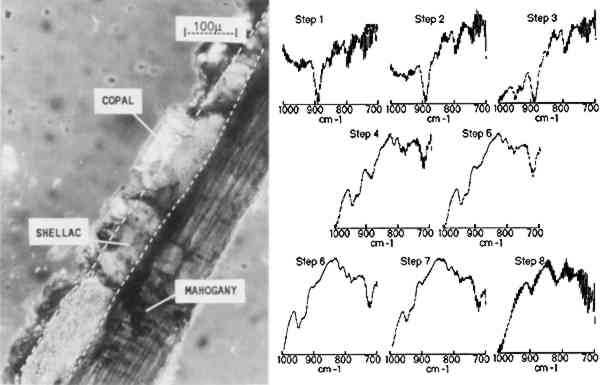
3.1 MULTILAYER SAMPLE ON MAHOGANY VENEERA photomicrograph of one cross section of a facsimile binary-layer resin sample, made by coating a mahogany surface with three coats of shellac followed by two coats of copal, is shown in figure 3. The infrared linear mapping experiment
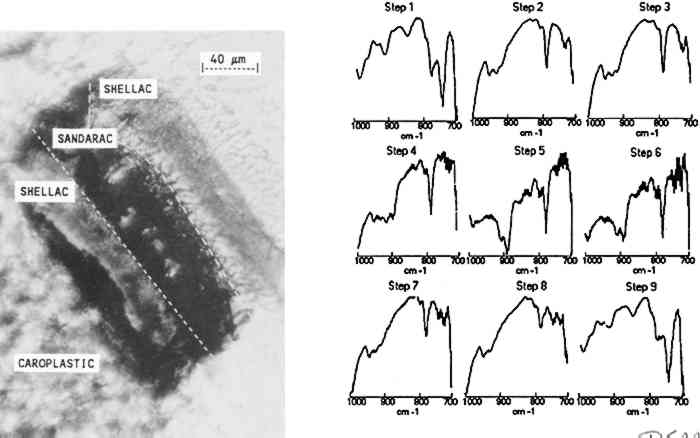
The results indicate that the transition from the copal to the shellac layer occurs in the area sampled by steps 3–4. The boundary between the layers is not expected to be sharp because is not necessarily uniform in its linearity across the sample and because the size of the aperture in the dimension perpendicular to the linear mapping axis is relatively large (400 μm). The size or thickness of each layer in the sample can be estimated by using the evidence supplied by relative intensities of the pertinent 3.2 MULTILAYER SAMPLES IN EMBEDDING MEDIASmall or fragile samples need the additional support of an embedding media before they can be microtomed. Five types of embedding media (wax, epoxy, acrylic, silicone, and polyester) were tested for their ease of sample preparation, clarity, and microtoming qualities. Epoxies were not selected because many of them required elevated temperatures to cure in a reasonable amount of time and because most were very difficult to microtome. Acrylics were undesirable because of their high solvent content and tendency to shrink 10–20% on curing. When cured, the silicones tested were not rigid enough to microtome. Test samples were embedded and microtomed successfully in the wax and polyester resin. While the paraffin worked as an embedding medium, it was not ideal due to its opacity. The polyesters (Bioplastic and Caroplastic) were selected for the embedding of the furniture finish samples because they cut One example of a test case using the polyester embedding medium was a cross section taken from a sample made by applying three coats of shellac on a Teflon surface followed by three coats of sandarac and three coats of shellac. The photomicrograph of this three-layered cross section is shown in figure 4 with the surrounding polyester embedding medium. Also shown is the sequence of IR spectra (1000–700 cm−1) obtained using 20 μm linear mapping steps of a 20 � 400 μm window. The spectra obtained at steps 1 and 9, which correspond to the outer edges of the sample, show a strong band at 735 cm−1 characteristic of the Caroplastic embedding medium. Spectra from steps 2 and 3 show the characteristic shellac bands at 945, 930, and 724 cm−1. The spectrum from step 4, collected at the interface of the shellac (outer) and sandarac layers, is a summation of absorbances due to both resins, which indicates the presence of both in the area sampled. The bands characteristic of sandarac, seen at 910 and 890 cm−1, predominate in the spectra for steps 5 and 6. The second shellac layer is apparent in the spectra of steps 7 and 8, which again show the characteristic bands for shellac at 945, 930, and 724 cm−1. Based on the infrared spectra, the size of the layers was estimated to be 50, 45, and 45 μm for the shellac (outer), sandarac, and shellac (inner) layers, respectively. These sizes correspond well with the measurement of these layers using an optical microscope.
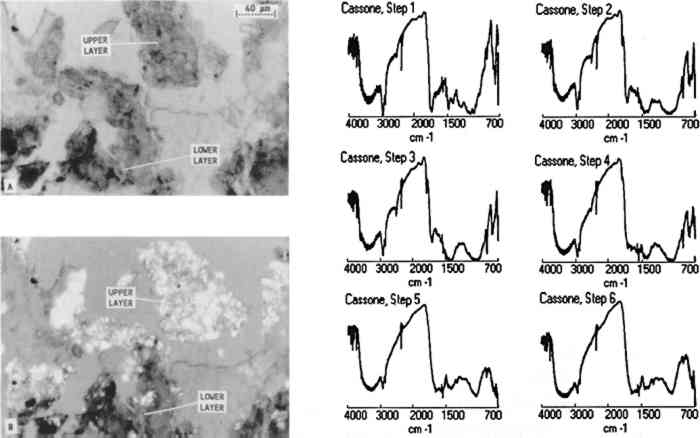
3.3 FURNITURE FINISH SAMPLES EMBEDDED IN POLYESTEROne furniture finish sample was taken from a 16th-century Italian cassone at the J. Paul Getty Museum (68.D.8) from near an insect-damaged area on the side. The photomicrograph of the cross section (A in fig. 5) shows that the sample clearly contains two layers. Examination of the sample between crossed polars (B in fig. 5) reveals that the sample contains a high proportion of inorganic materials, which could cause the atypical, crumbly characteristics of the microtomed slice. All other samples in this study were very cohesive and sliced nicely. Infrared spectra collected from the microtomed cross section (fig. 5) show that the lower layer contains glue and calcium carbonate (steps 5 and 6) while the upper layer contains shellac, calcium carbonate, and calcium sulfate (steps 2, 3, and 4). The glue layer may represent a fill or an old preparation layer since many of the chests were gilded. To determine whether these two layers exist on other areas of the cassone, another sample will be analyzed from a nondamaged area. As in all analytical methods, it is important to analyze several samples before making any projection about the overall composition of a finish.
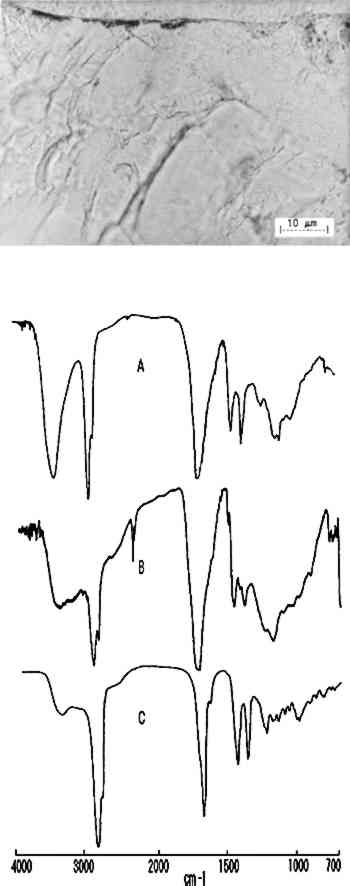
The next sample came from the back of the seat rail on a Duncan Phyfe caned-back sofa (New York, ca. 1815, U.S. Department of State Collection, L80.079). The photomicrograph of the sample (fig. 6), shows that it appears to contain a clear finish with a darkened area on the surface. The darkened area was very brittle and hard to microtome. The infrared analysis (B. in fig. 6, spectrum from step 4) produced similar spectra in all steps, indicating that the entire finish was mastic or dammar resin. The spectrum obtained from the darkened surface area produced only minor variations that could not be definitely attributed since the proximity of the embedding media to the surface causes spectral interferences.
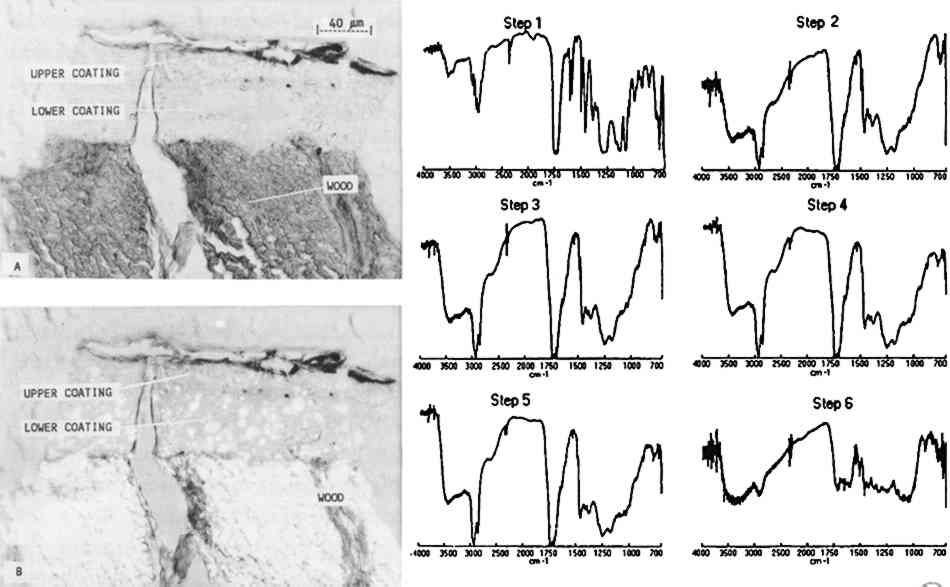
Some infiltration of the polyester medium into freshly prepared mastic layers was noted on the facsimiles. However, only minimal indications of infiltration were observed on the sample A photomicrograph of a microtomed cross section taken from a Paris Peace Treaty desk (British, ca. 1780, U.S. Department of State Collection, 64.010) is presented in figure 7. Through an optical microscope with normal (A) and polarized (B) transmitted light, the thin section appeared to have three distinct layers: wood, a lower coating layer, and an upper coating layer with a dirty surface. Infrared analysis of the sample, however, indicated that the entire coating was shellac. The full infrared spectra, 4000–700 cm−1, show the transition from the embedding media in step 1 (Caroplastic) to the wood in step 6. The coating on the wood, represented by steps 2–5, corresponds to shellac. There are some minor differences in the step 2 spectrum obtained from the outer surface of the coating. The sharp bands at 3010 and 1500 cm−1, along with the change in the band at 1460 cm−1, are due to the Caroplastic. Other small spectral changes may be due to a thin layer of dirt, oil, or wax or to surface oxidation, but none of these possible causes can be determined clearly from the spectra.
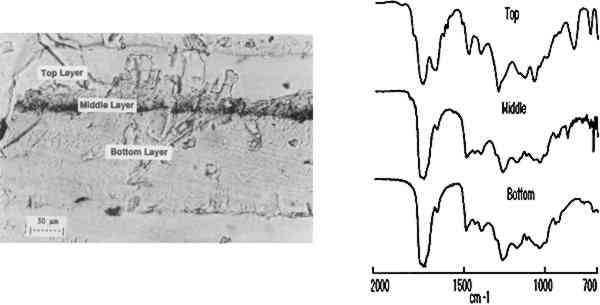
Previous analysis of the top surface of a German rolltop desk by David Roentgen (ca. 1785, J. Paul Getty Museum, 72.DA.47) had shown that the sample contained shellac, cellulose nitrate, and wax. But since this sample had been removed by scraping a small amount of
4 CONCLUSIONInfrared linear mapping microspectroscopy has been found to be a useful technique in the identification of individual layers in multilayered varnish samples. Thin section slices of multilayered cross-section resin samples suitable for infrared microscopic analysis were obtained by the use of embedding and microtoming techniques. Of the many embedding media tested in this study, the polyester type was shown to be the best for furniture varnish layers. Infrared spectra were obtained from analysis of 20 � 400 μm regions of the thin cross-section samples by systematic stepwise movement of sample stage under the apertured analysis window. This process yielded an infrared spectral linear map of each multilayer resin sample that provided information about composition, position, and size of finish layers. The resulting information can be used to elucidate the sequence of layer deposition. In our samples we found that the infrared changes correlated with visually apparent changes in the samples, but it is also possible to use the linear mapping experiment to identify changes in composition that are not visible under the optical microscope. Future work will be done to examine the effects of aging and refinishing on resin boundaries and surface oxidation. The lateral resolution of infrared microspectroscopy shows potential for the study of surface oxidation and its kinetics during the natural or artificial aging processes. Studies focused on examination of resin-resin interface might produce new data on the stability of the interface during refinishing. ACKNOWLEDGEMENTSWe would like to thank Frank Preusser for his support of this research. We are grateful to Brian Considine, J.Paul Getty Museum; Robert Mussey, Robert Mussey, Inc.; and Joseph Godla, Society for the Preservation of New England Antiquities, for providing us with samples for analysis. NOTES. Since the submission of this paper, we have found that microtoming can be significantly improved by the use of glass knives or tungsten carbide blades rather than stainless steel. Glass knives and tungsten carbide blades can easily produce thin cross sections REFERENCESAllen, S.1984. Wood finisher's handbook. New York: Sterling Publishing Co. Brachert, T.1978–79. Historic transparent varnishes and furniture polishes I–V. trans. R. Mussey. Maltechnik-Restauro (1978) 1:56–65, 2:120–28; 3:185–93; 4:263–74; (1979) 2:131–34. Bruun, H. H., and R.Sjoholm.1964. Studier �ver komponenter i tr�. Acta Academiae Aboensis Ser. B24(9): 3–15. Derrick, M. R.1989. Fourier transform infrared spectral analysis of natural resins used in furniture finishes. Journal of the American Institute for Conservation28:43–56. Derrick, M. R.1990. Infrared analysis of fragments from the Dead Sea Scrolls. Paper presented at the Western Association for Art Conservation Conference, Catalina, Calif. Derrick, M. R., D. C.Stulik, J. M.Landry, and M. R.Bolton.1990. Infrared microspectroscopic identification of binding media in paint cross sections: Application to works of art. Paper presented at the 1990 Pittsburgh Conference, New York. Feller, R. J.1954. Dammar and mastic IR analysis. Science120: 1069–70. Feller, R. J.1958. Special report on identification and analysis of resins and spirit varnishes.Pittsburgh, Pa.: Mellon Institute. Landry, J. M., S. P.Bouffard, M. R.Bolton, M. R.Derrick, and D. C.Stulik.1990. Applications of infrared mapping microspectroscopy to the analysis of art work stratigraphy. Paper presented at the Federation of Analytical Chemistry and Spectroscopy Societies 17th Annual Conference, Cleveland, Ohio. Low, M.J.D., and N. S.Baer.1977. Application of infrared Fourier transform spectroscopy to problems in conservation. Studies in Conservation22:116–28. Low, M.J.D., and N. S.Baer.1978. Dammar and mastic IR analysis. ICOM Committee for Conservation Preprints, ICOM 5th Triennial Meeting, Zagreb. 78/16/5/1–6. McGiffin, R. F.1983. Furniture care and conservation. Nashville, Tenn.: American Association for State and Local History. Masschelein-Kleiner, L.1986. Analysis of paint media, varnishes, and adhesives. In Scientific examination of easel paintings, ed.R.Van Schoute and H.Verougstraete-Marcq. PACT (Journal of the European Study Group on Physical, Chemical and Mathematical Techniques Applied to Archaeology) No. 13, Strasbourg: Council of Europe. 185–207. Mills, J. S., and R.White.1977. Natural resins of art and archaeology: Their sources, chemistry, and identification. Studies in Conservation22:12–31. Mussey, R. D.1982. Early varnishes. Fine Woodworking35 (July/August):54–57. Penn, T. Z.1984. Decorative and protective finishes, 1750–1850. Association for Preservation Technology Bulletin16(1):3–46. Thomson, G.1963. New picture varnishes. In Recent advances in conservation, ed.G.Thomson. London: Butterworths. 176–84. Soteland, N., and O.Elletsen.1964. Infrared spectroscopy as a tool in resin analysis. Norsk Skogindustri18:61–66. von Jayme, G., and G.Traser.1969. IR-spektroskopische untersuchungen an harzs�uren. Das Papier23:61–66. SOURCES OF MATERIALSPolyester resin (Bioplastic)Ward's Natural Science Establishment, 11850 E., Florence Ave., Santa Fe Springs, Calif. 90670–0567 Carolina Biological Supply Co., 2700 York Road, Burlington, N.C. 27215 AUTHOR INFORMATIONMICHELE R. DERRICK graduated from Oklahoma State University in 1979 with an M.S. in analytical chemistry. She joined the Getty Conservation Institute in 1983 and is currently an associate scientist. Her research involves the development of new methods for the characterization and identification of organic materials in cultural objects primarily using infrared spectroscopy and pyrolysis gas chromatography. Address: Getty Conservation Institute, 4503 Glencoe Ave., Marina del Rey, Calif. 90292. DUSAN C. STULIK graduated from Charles University (Prague, Czechoslovakia) with B.S. and M.S. degrees in chemistry. He obtained a Ph.D. in physics from the Czechoslovakia Academy of Sciences. He is currently head of the Analytical Section at the Getty Conservation Institute, where his research is in the application of modern scientific methods in conservation science. Address: Getty Conservation Institute, 4503 Glencoe Ave., Marina del Rey, Calif. 90292. JAMES M. LANDRY is associate professor of chemistry in the Department of Chemistry and Biochemistry at Loyola Marymount University. He received B.S. and M.S. degrees from Xavier University and a Ph.D. in inorganic chemistry from Miami University. He is currently on appointment as a senior fellow in the Scientific Program at the Getty Conservation Institute. His research interests include the use of infrared microspectroscopy in the analysis of artwork and cultural objects and the determination of volatile organic compounds given off in display and storage cases by gas chromatography-mass spectrometry. Address: Department of Chemistry and Biochemistry, Loyola Marymount University, Los Angeles, Calif. 90045. STEVEN P. BOUFFARD received his B.S. in chemistry from Loyola Marymount University in 1990. He is currently a doctoral candidate in analytical chemistry at Miami University. His research interests involve analytical applications of infrared microspectroscopy. Address: Department of Chemistry, Miami University, Oxford, Ohio 45056.
 Section Index Section Index |
