OBSERVATIONS ON THE DRYING OF PAPER: FIVE DRYING METHODS AND THE DRYING PROCESSJANE E. SUGARMAN, & TIMOTHY J. VITALE
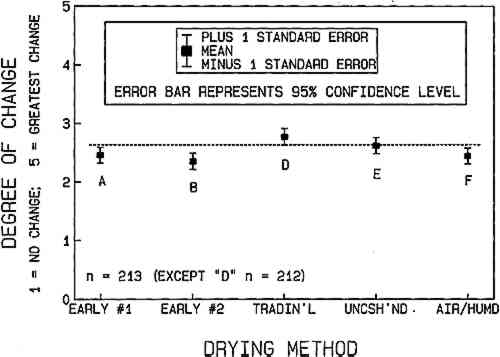
ABSTRACT—Three experiments were performed to examine the drying of paper. In the first experiment visual analysis was used to monitor change caused by five drying methods on the surface texture of 12 historic papers. Although all methods caused changes, the early restraint method was most successful, while the traditional method was least successful, at maintaining original surface texture. Some of the 12 historic papers altered more than others, but the characteristics of sizing, pressing, and fiber furnish could not be used to predict degree of change. In the second experiment papers were dried under laboratory conditions while water content and appearance were monitored. Papers were observed to pass through stages: flooded, glossy-dark matte, dark matte, light matte, onset of physical distortion, and white. The most important stage, onset of physical distortion, occurred at 63 � 3% solids in all papers and correlated with the start of hydrogen bonding between fibers and the shrinkage of fibers. These facts explain why the early restraint method is superior; it fixes the paper into a defined shape before the paper goes through the bonding and shrinkage process. In the third experiment the vapor humidification process was shown to result in 81 � 5% solids, which disrupts hydrogen bonds within fibers. It is unlike complete wetting, which, at 43 � 9% solids, disrupts hydrogen bonds both within fibers and between fibers. 1 INTRODUCTIONDrying is one of the most common treatments performed in paper conservation laboratories, yet it has been the subject of little formal study or research. Most of what is known is the accumulated wisdom of practitioners working in the field, passed from teacher to student or learned by the solitary practitoner during periods of frustration, misgivings, and sometimes elation. This paper is the first in a series. It presents the results of three experiments designed to quantify the effects of common drying methods and examine the wetting and drying process under controlled conditions. Experimental results and information from the literature are used to clarify why the drying methods that results in least change in paper texture are successful. In the first experiment the five drying methods chosen for testing can be divided into two groups: common paper conservation procedures and an experimental method. Once it was found that the experimental method was superior, the second experiment was undertaken to explore the reasons why it was superior. In the second experiment papers were dried under laboratory conditions, and appearance and degree of drying were quantified. A literature review offered vast information on the drying of never-dried pulp but could not answer the principal question: How does paper dry? The experiment established how paper dries, and most important, determined when a sheet begins to deform. Sheet deformation is correlated with the start of hydrogen bonding and the shrinkage of fibers. It was determined that early restraint of the sheet between blotters was successful because the paper was fixed in shape In the third experiment the humidification process of the two-stage, air-dried–humidification method was explored. Humidification is shown to be different from complete wetting. Moisture disrupts hydrogen bonds within the fibers causing softening and swelling. Complete wetting disrupts hydrogen bonds within fibers and between fibers creating complete disruption of a sheet. There is a vast body of literature discussing the effects of drying on the mechanical properties of paper. It has been the subject of extensive study by Vitale (n.d.). It is clear from this work that wetting and drying have effects on mechanical properties. It is unclear, however, that any of these effects have an aesthetic impact or that they have an influence on the stability of paper. Changes in surface texture have a direct aesthetic impact. Although surface texture is not the only consideration in determining drying treatment, learning to control surface texture and understanding the drying process can contribute to the decision-making process in conservation treatment. 2 OVERVIEW OF DRYING AND FLATTENINGThe treatment of drying and flattening is not performed unless another treatment occurs first. The most common initial treatment is washing, either to remove a stain or to rejuvenate the sheet by reducing free acidity. A sheet may need flattening, but the cockled or curled sheet must first be wet (humidified) before it can be flattened. The use of the term “drying” assumes the associated step of flattening. After a paper is wet, the process proceeds by these steps: the fibers swell, hydrogen bonds within fibers are broken, fibers are plasticized, fiber-to-fiber bonds in the sheet network are broken, and the aggregate sheet is plasticized. The structural conformation of the fibers is lost because the structural bonds fixing the components to one another are gone. The surface aesthetics of the sheet are lost. The disruptions created by wetting are reversed when the process is reversed, that is, when the paper is dried. However, the original mechanical conditions that molded the paper are no longer obtainable. The original surface texture is lost. When the wetting process is reversed without control or restraint, it is often called “free drying.” The free-drying process commonly yields a cockled sheet. Often, speed of drying is associated with degree of cockling, with anecdotal evidence suggesting that very slow free drying results in a fairly flat sheet. Cockles are due to uneven drying. When one area is wetter than the adjacent area in a sheet (i.e., the sheet displays small puddles of water), local planar distortion or cockling results. Slow drying encourages the dispersion of high water concentration to regions of low water content and therefore even drying. Controlling the speed of drying is therefore a treatment variable which should result in diminished cockling. Drying treatments are concerted efforts to control or engineer the redried surface of the paper. Conservation drying treatment is the process of pressing, with minimal pressure, a paper between absorbent surfaces while it dries. Intuitively, we know that a dry sheet has a fixed shape. Pressing involves holding a sheet in a defined shape (flat) while water is removed. Commonly, water is removed by contact with blotters. The capillaries and absorbent dry fibers in the blotters absorb the large quantities of water in the wet sheet until an equilibrium water content is reached. Blotters are changed to keep the migration of water moving out of the sheet. Eventually the blotter in contact with 3 GENERAL INTRODUCTION TO PAPER TEXTUREThe science of describing and measuring surface texture is in its infancy, although aesthetic appreciation of paper surface texture has been with us as long as paper has existed. At one time paper was merely an economic replacement for the celebrated and romanticized vellum leaf. Over time, the romance and appreciation of paper have generated great appreciation for paper texture in all its forms: smooth, glossy, rough, original, calendared, hot pressed, coated, pebbled, and so forth. Specialists can distinguish even an expertly treated sheet from a never washed sheet by subtle differences in texture and drape. The scientific vocabulary for texture is not established. In our work, we have found that the generic term “surface texture” is actually composed of three discrete domains. The smallest textural domain concerns the fibers as they are adjacent to one another, generally within one square mm; this is called “surface grain.” In the range of one square cm, clumps of hundreds of fibers are offset from one another in the third dimension; this is called the “surface texture.” On the largest scale, a 10 cm (4 in) square, whole regions of a sheet can be higher or lower than the adjacent region; this is called “cockling.” All these features can be seen with the eye; all can be photographed using raking light. Surface grain can be perceived by the eye and can be seen in some fine-grained, well-shot raking light photographs, but it is most effectively visualized at 22x using raking light.1 Surface texture is perceptible in raking light and easy to see at 2–5x using raking light. Cockling is clearly discernible in raking light. Quantifying changes in surface texture is difficult. After extensive practical research into the analytical quantification of paper texture, we found that statistical analysis of the observations of a large group of practiced observers proved to be the most successful methodology. 4 EXPERIMENT 1: EVALUATION OF DRYING AND FLATTENING METHODSThis experiment explored the effects of five different drying procedures on the surface qualities of 12 historic papers (Sugarman 1985). The five drying methods (summarized in table 1) were chosen to: compare a new, experimental drying method—the “early restraint” method and a variant—with two common drying methods, the “traditional” (and a variant, the “uncushioned method”) and “air-dried–humidification” methods. The common drying procedures, altered somewhat in this project for research purposes, were developed over a long period of craft experimentation. The primary development criteria appear to have been to meet the needs of private practice (speed and large numbers of artifacts) and the need to achieve consistently satisfactory results on a variety of paper types. The “early restraint” method was developed (and continues to be modified) by the Paper Laboratory at the Winterthur Museum to achieve the minimum alteration in surface texture. TABLE 1 SUMMARIES OF DRYING METHODS 4.1 DRYING METHODSTwelve historic papers were selected to include a range of surface characteristics resulting from variations in pressing, sizing, and fiber furnish (table 2). Samples were all cut from the same sheet into 2 � � 2 � in test blanks and bathed in water for � hour. They were then dried by the methods described below. TABLE 2 TEST PAPERS 4.1.1 Early restraint method 1 (A)The samples were removed from the bath to a blotter on a nylon mesh support. When the luster left the paper and the surface of the paper regained its original appearance, the samples were placed between fresh blotters, dimensions of which were well in excess of the samples' edges. The blotter was covered with a foam rubber pad. After about 2 minutes the blotters were changed, and the samples (between bloters) were placed between � in thick felts and under plate glass. The blotters were changed the next day, after 1 week, and after 3 weeks.2 4.1.2 Early restraint method 2 (B)This method is the same as the above, but with lens tissue placed in contact with both sides of the object in the “sandwich.” This variation on method A was selected to observe what the effect of subtle differences in the texture of the material closest to the object might be. 4.1.3 Traditional method (D)The samples were removed from the bath on a nylon mesh and allowed to drain. The samples were placed on a blotter with uniform contact between samples and blotter and allowed to dry 15 minutes (until approximately “⅔ dry”). They were then placed between two blotters, on top of a thick (� in) foam rubber pad, under a sheet of glass with two 5-lb weights on top. The blotters were changed after 5 minutes, 10 minutes, 30 minutes, 1 hour, 4 hours, and the next day. 4.1.4 Uncushioned method (E)The samples were removed from the bath, placed on a blotter, and allowed to dry 15 minutes (as above). They were dried between blotters, under glass and two 5-lb weights. The blotter changes were the same as in method D. 4.1.5 Air-dried–humidification method (F)The samples were removed from the bath (as above), placed on a blotter, and allowed to dry completely. They were placed in a humidification chamber. The relative humidity in the chamber rose slowly to 95%. The samples remained in the chamber until they were relaxed, for a total of 5 hours. The samples were then dried between blotters and felts, under glass and two 5-lb weights. The blotters were changed after 10 minutes, 1 hour, and the next day. 4.2 EXPERIMENTAL DESIGNThe method used for analysis was visual examination by trained observers. Statistics are employed to determine if drying methods can be distinguished from one another. The samples were assessed by 18 trained observers (16 conservation students and 2 professional paper conservators) under raking light in a uniform experimental protocol. An evaluation of the relative success of the drying procedures focused on subtleties of surface qualities.3 Each person completed a survey form, making an independent judgment of the relative amount of change (scale 1–5) of each treated sample compared with the untreated control. Thus a sample that had no change in surface texture would be assigned a value of 1, while a sample with major change would be assigned a 5. Sheet cockling is not a phenomenon that could be observed in this study because the samples were too small. The periodicity of Analysis of the entire data pool using simple statistical methods was carried out to determine the significant difference in (1) and 12 papers, and (2) the five drying methods. Figures 1 and 2 show the results of the mean and standard error calculations. The statical error bars reported in figures 1 and 2 consist of the mean, plus and minus 1 standard error times t for a two-tailed 95% confidence interval. The full bar indicates the data population at a 95%-confidence level. Data populations for which error bars fall beyond each other are considered significant at a 95%-confidence level or greater. Standard error is standard deviation (calculated using n-1) divided by the square root of n, times the “t” value for a confidence level of 95%, at the appropriate degree of freedom.
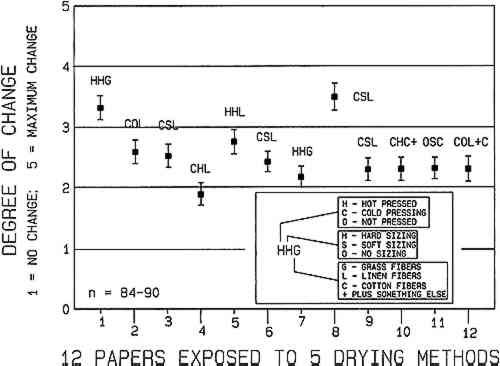
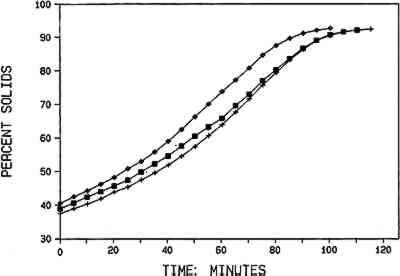
4.3 RESULTSAnalysis of the visual survey data yielded the following conclusions (see fig. 1). The early restraint method 2 (B) resulted in the least change of surface texture for the group of 12 experimental papers. The early restraint method 1 (A), without lens tissue interfacing between the samples and the blotters, could not be statistically distinguished from the traditional restraint method 2. The traditional method (D), so called because the paper is air dried for a “traditional” period on blotters prior to press drying, resulted in the greatest change in surface texture and was statistically distinguishable from the superior early restraint method 2. The uncushioned method (E), a version of the traditional method, could not be statistically distinguished from the early restraint method but could be distinguished from the early restraint method 2. The air-dried–humidification method (F), a two-stage drying method that was thought likely to be an unsuccessful drying method, could not be distinguished from either of the early restraint methods. The superiority of the early restraint method 2 is seen as significant. The method was developed within the conceptual framework of the papermaking process but without knowing how following the papermaking process might facilitate the reproduction of original surface texture. The primary goal was to develop a technique that would result in the least change in surface texture after treatment when compared to a never-treated control. It is clear that these efforts were successful. All of the drying methods produced changes in the samples with respect to the controls; that is, all of the means are above 2.3 units, with 1 unit equal to no change. The methods that showed least change (A, B, and F) have mean between 2.3 and 2.45 units, and those that showed most change (D and E) have means between 2.6 and 2.7 units. Methods A, B, and F hold the paper flat during the drying process. Methods D and E permit the paper to become two-thirds dry before the paper is held flat between drying surfaces. It is important to note that there are significant differences between methods A and B and method F. Methods A and B fix the flooded paper between smooth absorbent drying surfaces while the paper is still wet. Method F, a two-stage technique, allows the paper to dry completely; then, after humidification in the second stage, the paper is held flat between smooth absorbent surfaces. While the observers were not required to specify the nature of the changes they reported, some did comment that all of the texture changes were an expansion of the original surface texture. Expansion is perceived as an increase in the height of the high regions in relation to The results based on individual papers can be observed in figure 2. The reasons the data are considered in this manner is that it was strongly suspected that characteristics such as pressing, sizing, and fiber furnish (pulp) would have an effect on the ease or difficulty in reproducing the original surface texture of individual papers. It is clear from a review of figure 2 that some papers (those above 3 units) were difficult to dry; one (below 2 units) was relatively easy to dry; but most (ranging from 2.2 to 2.8 units) were to equal difficulty. There is no pattern for best, average, or worst performance based on any of the three characteristics—pressing, sizing, pulp—noted. Three of the samples labeled CSL (cold-pressed, soft-sized, linen) (3, 6 and 9) are all within 95%-confidence levels, but so are six of the other nine samples. Sample 8, also a CSL-type paper, is well outside the 3, 6, and 9 group, therefore eliminating the possibility that cold-pressed, soft-sized, linen paper poses only moderate soft-sized, linen paper poses only moderate drying obstacles. The two most changed papers, 1 and 8, have exactly opposite characteristics. The least changed paper, 4, is closer in characteristics to the most changed, paper 8. Of the papers in the 2.2–2.8 unit range, no single characteristics predominates: (1) two hardsized papers are in the largely cold-pressed group, (2) all sizing types are represented, and (3) all fiber furnish types are included. Lack of trends is an indication that pressing, sizing, and fiber furnish cannot be used to predict if a support will be sensitive to drying. 4.4 OTHER ANALYTICAL TECHNIQUES INVESTIGATEDIn the couse of evaluating the results of the data presented above, several other analytical methods were investigated4 to determine if changes in the treated samples could be quantified with more precision than the available with visual analysis. All attempts to analyze and compare characteristics of surface texture using the following analytical methods were inconclusive in distinguishing the subtle differences in surface texture among the test samples. The use of reflected light measurement seemed a promising source of analytical data. Intensity measurements at 0�incident/0� reflected did not allow any differentiation of texture. Reflected light intensity, from the surfaces of a set of samples at (1) 45�/0� (illumination/measurement), (2) diffuse/0� at both 8 mm and 50 mm port size, and (3) specular include and exclude on a device with an integrating sphere light source and measurement, yielded data that were either inconsistent or inconclusive. In most cases a set of samples with clearly distinguishable texture could not be separated using the means of 3–10 repetitions, let alone using standard statistical analysis, Goniophotometric analysis of the surface, where a detector passes through an arc prescribed around the incident illumination source, could distinguish between the best and worst samples of paper 8, but standard statistical analysis resulted in an indistinguishable outcome. Differentiation of samples Attempts were made to visualize differences in the treated surface using the scanning electron microscope (SEM) in hope of defining a characteristic of the modified surfaces. This methodology is often suitable in paper studies because the fibers appear solid and well defined rather than as translucent glowing bodies surrounded by a ill-defined radiant background, as seen when viewed with a light microscope. Three viewing angles were employed: direct viewing, low-angle viewing of surface texture, and cross-section viewing. While very informative and instructive, the resulting observations did not lend themselves to analytic interpretation or quantification. Report of these negative results may save other researchers some effort. Experienced observers were found to be the most sensitive judges of changes in surface texture. Surface texture is a complex intellectual integration of viewing angle, light and shadow, and experience. At the time (1986), there was no analytical technique that could equual the sensitivity and sophistication of the trained human observer in distinguishing subtle visual differences in paper surface texture.5 Eventually, complex integrations of multiple finite scans (Arney 1990) or artificial intelligence might supersede the ability of the trained observer. 5 EXPERIMENT 2: QUANTIFICATION OF THE DRYING PROCESSIn this experiment the paper-drying process was observed and quantified to determine why the application of restraint between absorbent flat surfaces was important to the final surface texture of the test papers. The distinguishing feature of the most successful method for preserving surface texture—the early restraint method—is that the sheet is put under restraint in a wetter condition than in the traditional and uncushioned methods. 5.1 EXPERIMENTAL DESIGNA group of seven papers representing a range of ages, compositions, and surface appearances were selected (table 3). In the procedure detailed in appendix 1, each sample (8 � 10 cm) was immersed in water, then carefully monitored while it air dried on a balance accurate to 10−4 grams. The samples were supported on a stainless steel screen and suspended above a source of reflected light, in the balance. A visual description and weight measurement were recorded by a single observer at 5-minute intervals for three samples of the seven papers. TABLE 3 PAPERS USED TO QUANTIFY THE DRYING PROCESS Three samples of each test paper were observed by the same person as they dried. Each of the individual drying experiments yielded a high level of agreement within a set of three samples and among the seven papers. This agreement is reflected in (1) the similarity of plots in figure 3, and (2) the ranges of percent solids listed for the observed drying stages in table 4.
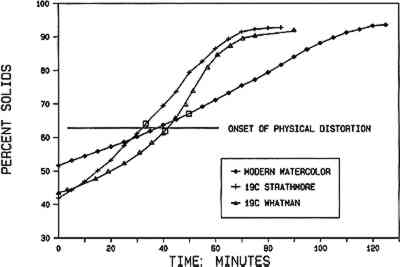
TABLE 4 STAGES OBSERVED DURING DRYING OF EXPERIMENTAL PAPERS 5.2 DRYING STAGES OBSERVEDThe samples were observed to pass through a series of discrete visual stages. When first removed from the bath, the sample is flooded (stage 1). When the sample is placed on the drying screen, the surface appears glossy. The overall glossiness fades fairly quickly, with patches of dark matte surface texture interrupting the overall specular gloss (stage 2). The surface water creates a specular gloss that hides the texture of the fibers and the dark translucency of the sheet. The water-filled paper is translucent. The dark appearance was due to light passing through the sheet rather than scattering at interfaces of large refractive index difference, such as between air and cellulose. The matte texture is due to the individual water-swollen fibers forming a rough surface, in comparison to a smooth, unbroken surface formed by a continuous water layer. The dark matte appearance is achieved after all of the “flooded” water evaporates from the surface (stage 3). While remaining matte in appearance, the dark tone slowly decreases as the translucency decreases. The reducing translucency, due to decreasing water content, shades into opacity as light is scattered from the newly formed air-water and air-cellulose interfaces. Eventually Not all of the papers went through all of the stages. Samples that were relatively thin tended to have only one identifiable matte stage. Their appearance changed from glossy and translucent to matte and opaque. It should be noted that the experimental design emphasized the papers' translucency. Drying on a blotter would diminish perceptible translucency because there is little light reflected from below. In figures 4 and 5, the drying time is plotted against percent solids at 5 minute intervals.
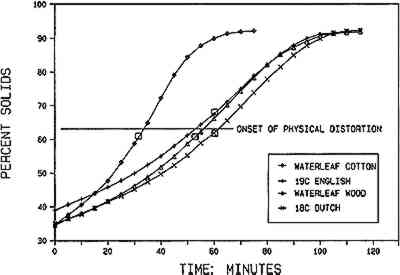
5.3 TWO GROUPS OF PAPERS DISTINGUISHED BY DEGREE OF SIZINGThe seven papers were studied extensively as to porosity,6 thickness, fiber type, shape, and degree of beating or age-related damage (as expressed in the measure of relative fiber length).7 It became clear after quantification of the drying process that the one factor that was a predictor of drying behavior was degree of sizing. If plots for all seven experimental papers were overlaid onto the same graph, (1) two distinct groups can be delineated on the basis of groupings of percent solids at specific drying stages, and (2) one drying stage is constant in both groups: onset of physical distortion. The seven experimental papers can be classified as unsized or lightly sized (group 1) and sized with gelatin and alum-rosin (group 2). Group 1 papers had relatively long drying times that start at lower percent solids (higher water content). Group 2 papers start the drying process with less absorbed water; thus their drying times are shorter. When a paper is immersed in water, the pores fill with water and the fibers begin the process of absorbing water and swelling. Depending on degree of beating and degree of sizing, the fibers eventually absorb water into their accessible micropore structure and across all of the accessible hydrogen-bonded sites. Historically, sizing is applied to paper by the papermaker to hinder water absorption into the fiber and thus prevent the feathering of water-based ink lines. It is clear, then, that the role played by the fibers in the adsorption and desorption processes is significant. In unsized papers the relative accessibility of the fibers to water causes greater water absorption and swelling, while in sized papers the role of the fibers is diminished, with the pore system dominating the drying process. Sizing or lack of it, then, accounts for most of the differences in patterns of drying. Group 2 papers begin at higher percent solids content (less water) and show rather distinct drying phases. Note that in figure 5 the starting percent solids for group 2 papers is 42%–52% solids. The watercolor paper, which is manufactured with a high degree of sizing, has the highest percent solids—52% (lowest water content). Compare this to the figure 4 starting percent solids of 34%–38%. Distinctness of drying stage is a function of progressing to the next stage in a crisp, direct manner without the (time) smearing effects due to slower evaporation of water from the fibers. The function of sizing is to decrease the amount of moisture the fibers absorb. With a large number of potential sites for water absorption occupied by sizing material, the fibers become only partially saturated. Fibers in sized papers act more like glass fibers in a mat, with water taken up and released predominantly through the pore system, (assuming the pore systems are relatively unclogged by the sizing). In unsized papers, the fibers contain more water and hold onto moisture much longer; thus the drying process is extended. One important finding should be emphasized: both groups exhibited the onset of physical distortion at 63% solids. The process that creates distortion must therefore be independent of the amount of water uptake and speed of drying.
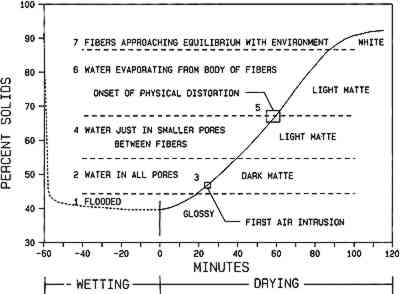
figures 4 and 5 reveal that one paper in each group has a plot that, on first observation, appears 5.4 DRYING STAGES OF PAPER DEFINEDThe drying stages observed on the seven experimental papers can be related to the literature on the formation, consolidation, and drying of never-dried pulp into paper, although once-dried paper is different from never-dried paper pulp. In experiment 2, the appearance of the paper is described for each state of drying (fig. 6). Figure 6 shows the seven stages of drying for an average paper based on the observations made in experiment 2.
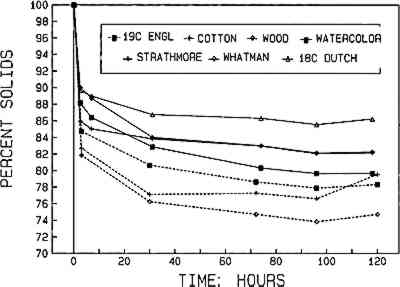
5.4.1 Stage 1. Flooded: GlossyWhen the paper is removed from the bath, it is flooded and appears glossy. Water is in a continuous film throughout the paper. Pores, lumens, fiber micropores, and fibers are full. 5.4.2 Stage 2. Water in all pores: Glossy with regions of dark matteThis initial drying phase involves the removal of excess water. The excess water, beyond the free water held in the paper pores, decreases without the intrusion of air (Robertson 1963). As excess surface water continues to evaporate, free water remains in all pores, and the surface is no longer covered with a continuous film. Eventually the overall glossy appearance is broken up by dark matte regions. The matte texture is caused by fibers on the surface that are no longer covered by the flood of water. Saturation of the pores (normally air-filled voids) with liquid creates a dark appearance; the paper is highly translucent; no light is scattered at interfaces between water and fibers. Light transmission through the sheet is at a maximum, and scattering is at a minimum (Robertson 1963). 5.4.3 Stage 3. First air intrusion into large pores: Dark matte-translucentIn previous stages water formed a continuous film throughout the paper, surrounding each fiber and each fiber-to-fiber contact point. At this stage, the fibers and paper pores are full of free water, but there is no excess water. As water volume decreases due to evaporation, the largest pores begin to lose a small amount of water. Air begins to intrude into the sheet. However imperceptible, the sheet is slightly lighter in tone due to the increased scattering of light at the small increase in air/fiber surface area. 5.4.4 Stage 4. Water in smaller pores: Light matteFree water is in most of the pores at the start of this stage. As the stage progresses, the largest pores are the first to empty. The paper becomes light matte as more air intrudes into the pore structure of the paper, creating additional air/cellulose interfaces. Toward the end of this stage only the smaller pores contain water. A precise characterization of the differences between light and dark matte is impossible; it is a subjective judgment. The increasing number of sites in which there is a difference in refractive index between cellulose and air cause increased light scattering and reduced transmission of light. The progressive effect is an increasingly opaque appearance. As air intrusion increases, the constant rate of drying in the first stage of evaporation (Rance 1954) ends. Robertson (1963) describes this as the point when free water is not mobile enough to maintain a stationary evaporation zone at the face of large pores close to the surface. Free water exists, but its mobility is limited to a small region defined by the zone of contact between two fibers. Capillary action holds the water in the small pores of the zone surrounding the fiber-to-fiber bonding regions. Note that the light matte stage extends past the onset of physical distortion (stage 5), described below. 5.4.5 Stage 5. Onset of physical distortion: Hydrogen bonding and shrinkageOnset of physical distortion is the point within the light matte stage when bonding and shrinkage start. Bonding fixes fibers to one another so that as shrinkage occurs, localized differences are transferred to the network. The result is sheet distortion. It is quite possible that some fibers begin to shrink prior to the creation of hydrogen bonds between fibers. Shrinkage of the fiber network before this point is primarily in the z-direction (thickness). Monitoring the thickness of the samples as they dried was not undertaken in these experiments. This phenomenon has been When the localized free water of a region is in only the smallest pores—those between fibers at fiber-to-fiber contact areas—the surface tension of the water and the size of the capillary between the fibers result in a capillary force that draws the fiber surfaces together (Rance 1954). Eventually the fibers are drawn physically close enough for hydrogen bonds to form; this is at approximately 2.7 �, surface-to-surface distance (Skelton 1975; Christiansen and Giertz 1966). Fiber-to-fiber bonding begins at approximately 45% solids in a never-dried sheet (Robertson 1963). We have found the bonding begins in once-dried paper at 63 � 3% solids. Fibers shrink because they lose bound water. Evaporation of bound water can occur only when free water, or free water associated with the surface of the fiber, is gone. When bonding begins, no free water is available by definition, because it is all associated with fiber-to-fiber bonding zone. In a region of bonding, fiber segments not participating in bonding do not have free water surrounding them. The lack of free water along the exposed fiber shaft, which would have replaced evaporating bound water, causes the fibers to shrink locally. Evaporation of bound water in the fiber is a local phenomenon causing additional uneven shrinkage along the fiber. Concurrent hydrogen bonding and fiber shrinkage cause distortion of the fiber network. With the contact points between fibers fixed by hydrogen bonding, the shrinking fibers begin to distort the network, moving regions out of their original x-y planes into the z-direction. When enough displacement in the z-direction has occurred, distortion can be seen in the paper. Uneven drying always leads to sheet distortion. If the paper is allowed to dry without restraint in the z-direction, cockling will occur because the edges dry more quickly than the center. It is clear that the hydrogen-bonding process continues after the original establishment of hydrogen bonds, because tensile strength increases throughout the evaporation process (Robertson 1970). Shrinkage of the bonded fibers continues until the bound water content comes into equilibrium with the humidity content of the air. 5.4.6 Stage 6. Water evaporating from the fibers: Light matteThis stage is the latter half of the light matte stage, which began at stage 4. It is not visibly different from the stage 4 and was not observed as a distinct stage when the experimental observations were quantified but was added to increase clarity in the presentation of the drying process. The light matte stage is clearly divided, however, by the onset of physical distortion. In this stage, bound water is primarily evaporating from the body of the fiber. A small amount of water associated with the bonding sites is also concurrently evaporating. The sheet continues to be a light matte tone. The primary cause of increased sheet lightening is additional light scattering from air-cellulose interfaces within the fibers. Prior to this stage, the fibers were saturated and dark; during this stage the drying fibers are becoming lighter. The same phenomenon of air intrusion into the sheet also holds true for the fibers. As more air intrudes, the effect is an increasingly opaque appearance of the fibers. The water content passes through the fiber saturation point when all free water is gone, prior to the evaporation of bound water. At that point the voids in the fibers are empty, but the walls of the fibers are still saturated (Christiansen and Giertz 1966). At a point beyond the fiber saturation point (approximately 19 � 5% water), the translucency of the fiber begins to 5.5 SEVEN FIBERS APPROACHING EQUILIBRIUM WITH ENVIRONMENT: WHITEAs the fibers approach equilibrium with environment, the paper appears white due to almost total air intrusion. Small amounts of water continue to diffuse through the fiber to an evaporation surface. Within the drying fiber, evaporation does not continue indefinitely; it continues until an equilibrium moisture content is reached with the surrounding air. Under normal conditions the percent water content of the sheet will always be greater than zero unless an effort (such as exposure to hot drying oven conditions) is made to remove the bound water (Christiansen and Giertz 1966). The average for the seven experimental papers at 50% RH was 6% solids. 6 EXPERIMENT 3: PROLONGED HUMIDIFICATION OF SEVEN PAPERSTo determine whether humidification wets the paper sufficiently to allow complete relaxation before redrying, a study of the humidification stage of the two-stage air-dried–humidification method was undertaken following the procedure described in appendix 2. It was assumed early in this research that the air-dried–humidification method would be a poorly performing drying method, but the results of experiment 1 do not support this conjecture. An investigation of the uptake of moisture in a humidification chamber was conducted to determine (1) how much water is absorbed during humidification and (2) if the water content changes over a prolonged period of exposure to water vapor. Spraying and ultrasonic humidification treatments consist of the transfer of liquid water, broken into droplets, to the sheet being treated. Because these methods can result in any desired water content, even to the flooded state if continued long enough. Spraying and ultrasonic humidification are to o variable for scientific investigation. Only humidification with water vapor is studied here. It has been widely assumed, that water vapor humidification will result in sufficient water content to plasticize paper and result in a “gentle” flattening. 6.1 RESULTSResults reported in figure 7 clearly indicate that after 5 days in the humidity chamber (far exceeding the amount of time employed in standard practice) the maximum percent moisture content does not go below 81 � 5% solids or 19% water. After 3 hours the papers were 86 � 4% solids, or 14% water. Swollen with water, fibers in the papers represented in figure 5 are at their fiber saturation points but not beyond. Both values are well above the 63 � 3% solids required for interfiber hydrogen-bonding release.8 At the fiber saturation point there is no water in the paper pores. Thus vapor humidification does not release the fiber-to-fiber network hydrogen bonds.
Humidification does not result in a sufficient uptake of moisture to put water in the paper pores, which would result in a breakage of fiber-to-fiber hydrogen bonds (Christiansen and Giertz 1966). Humidification with water vapor causes a plasticization of the paper fibers due to the rupture of hydrogen bonds within the fibers. Bond breaking occurs because water is substituted across existing hydrogen bonds. When a single water molecule bridges between Eventually all cellulose surface area, fiber micropores, and accessible hydrogen bonds have water molecules associated with them: The fiber is at the fiber saturation point and completely plasticized. Plasticization is a state in which the rigidity of the fiber, due to “structural” hydrogen bonds between cellulose chains, elementary fibrils, microfibrils, and fibrils, have been disrupted. Plasticization releases stresses that were dried into the fibers when the sheet dried (Rowland 1979). When rewetting is performed with liquid water, the effects are different (Christiansen and Giertz 1966). Liquid water will eventually saturate the fibers and begin to form a liquid film. The liquid film will eventually fill capillaries at bonding sites and disrupt the fiber-to-fiber hydrogen bonds. If enough water is applied to the sheet, it will reach the flooded state depicted in (stage 1) of figure 6. When the sheet redries, the process of bonding between fiber surfaces is repeated. The extent of unbonding and the accompanying relaxation of dried-in stresses are greater with liquid water. Humidification does provide fiber relaxation, but only a more thorough wetting breaks a sufficient number of bonds to reform a cockled sheet. In order to allow sufficient relaxation of the paper for replication of original surface texture, liquid water in the form of fine spray or ultrasonic humidification is necessary. It should be noted that first exposure to humidification or rewetting In figure 1 the mean for the air-dried–humidification method appears to be similar in degree of change to the early restraint methods. It is believed, however, that the two drying methods are fundamentally different because the fibers are merely plasticized during vapor humidification. Complete wetting results in breaking fiber-to-fiber bonds and rupturing the fiber network. Properly applied flattening following a thorough rewetting will result in reformation of the network bonds in a new flat configuration. This assertion will be explored in future work. 6.2 IMPLICATIONS FOR TREATMENTFor flattening, when possible, exposure to liquid water—whether, by ultrasonic humidification, or spraying—is preferable to humidification with water vapor because the paper relaxes more with increased wetting. To control the surface quality of the sheet, the object should be placed under restraint as soon as possible, given the condition of the media. 7 CONCLUSIONSAll five drying methods caused change in surface texture. The early restraint 1 and 2 and air-dried–humidification methods were noticeably more successful than the traditional and uncushioned methods in maintaining original surface qualities. Drying methods that hold the paper in contact with a flattening surface through the entire drying process produced the least change in surface texture. The early restraint method of drying is distinguished from the others tested by the relatively high water content at which the paper is put under restraint. Close observation and quantification of the drying process make it clear that the early restraint defines the shape and texture of the sheet before hydrogen bonding and shrinkage can begin at 63% solids. Subtle differences in the drying methods that varied the drying surfaces in contact with the sheet, such as the difference between early restraint 1 and 2, could not be statistically distinguished at the 95%-confidence level. Some papers change more than others when exposed to the wetting and drying treatment. Pressing, sizing, and fiber furnish could not predict how much change would occur in surface texture. The absence of sizing material increased the amount of water absorbed and elongated the stages of drying. Thus, although type or degree of sizing could not be used to differentiate degree of change in paper texture, it had an influence on the rate of drying. Since sizing affects the rate of drying and sizing did vary among the 12 experimental papers, the rate of drying does not appear to influence the final appearance. Drying of paper can be seen as a succession of stages: flooded, glossy-dark matte, dark matte, light matte, onset of physical distortion, and white. The onset of physical distortion, which occurred during the light matte stage, coincides with hydrogen bonding and shrinkage of fibers. This point occurred at about 63% solids for all papers tested. Humidification with water vapor results in the fibers attaining the fiber saturation point, a maximum of 86% solids after 3 hours and 81% after several days, a level insufficient to fully break and reform structural hydrogen bonds in the fiber network. ACKNOWLEDGEMENTSJohn Krill, paper conservator, Winterthur Museum, Winterthur, Delaware, developed the early restraint methods, his insight and skills are deeply appreciated. Walter Brown, head of the APPENDIX1 APPENDIX 11.1 EXPERIMENT 2: QUANTIFICATION OF THE DRYING PROCESS1.1.1 EquipmentWeight measurements were made on a Mettler Balance (Model AE 160) accurate to 10−4 grams. This model has the advantage of visibility from three sides and the top as well as easy access for sample manipulation and photography. A rigid stainless steel screen supported by a shaped wire stand (also stainless steel) was used on the balance pan to raise the sample into the middle of the chamber. This configuration allowed free movement of air around the sample. Other materials, including Teflon screening attached to Fome-Cor, were tested and found to be sensitive to changes in relative humidity. In related experiments,9 aluminum was also judged unsatisfactory for such work. Stainless steel was selected because it is non-reactive to changes in relative humidity. Samples were dried in a dry Stabl-Therm oven manufactured by the Blue M Electric Company. The temperature was stable at 105 � 2�C. 1.1.2 ProcedureThree samples measuring 8 � 10 cm were cut of each kind of paper (except for sample 3). All samples were subjected to the procedures described below. The sample, which had been allowed to equilibrate with conditions in the paper laboratory (50 � 2% RH at 72� � 2�F) was weighed. The sample was then placed in a bath of deionized water for 2 hours. It was removed from the bath with tweezers, placed on a blotter to remove dripping water, then positioned on the stainless steel screen on the balance. The sample was allowed to air dry. After its weight and visual appearance were recorded it was placed on the balance, and every 5 minutes thereafter until it was approximately the same weight as before wetting. All of the doors of the balance were left open to facilitate drying. Each time a sample was to be weighed, the doors were closed and the balance allowed to reach equilibrium. The door at the top was then slid open, and a black-and-white 35 mm photograph was taken from above. The weight registering on the balance at the moment of the photo flash (or as close as possible) was recorded. The photographic record has not been used, thus far, in this study. After air drying, the sample was placed in a Mylar envelope sealed by means of a sonic sealer on three sides. A small loop of stainless steel
2 APPENDIX 22.1 EXPERIMENT 3: PROLONGED HUMIDIFICATION OF SEVEN PAPERS2.1.1 ProcedureAfter experiment 1 (immersion, observed drying process, and oven drying) each sample was removed from the mylar envelope in which it had been oven dried and placed in a paper folder. After several weeks' exposure to ambient laboratory conditions (50 � 2% RH at 72� � 2�F), the samples were subjected to prolonged exposure to high relative humidity in a humidity chamber. A stainless steel tray was fitted with a stretched polyester screen suspended over a blotter, which was kept wet throughout the 120-hour period. The tray was kept covered with a �-in thick Plexiglas sheet. The humidity chamber was monitored with a dial hygrometer, the relative humidity never reached 100% RH but hovered around 95% RH for the entire period. NOTES1. A series of 35mm slides at 0.1x, 3x, and 22x was made of a smooth waterleaf cotton paper dried under a variety of conditions that both increased texture and decreased texture. These were presented in a lecture format to an audience of paper conservators. Many if not most of those in the audience were capable of observing the three different textural domains. 2. Paper conservators know from experience that in drying paper from a flooded state, a “blot off” is required. Without this quick initial blotter change to a smooth blotter, the cockling blotters will distort the object. We believe that the early blotter changes are important to prevent sheet distortion. We also believe that an extended period of drying, after the initial blotter changes, is vital because intermediate blotter changes could fall during the critical period after the onset of physical distortion (at 63% solids, as explained in section 5.3). Determining the ideal length of the slow drying process was not a subject of this study. We believe the several weeks allowed in the early restraint method was probably excessive. 3. The qualities of “surface texture” and “surface grain,” as described in section 3, were not articulated to the trained observers. In retrospect, we recognized that these are the two texture domains that were judged. 4. All of the analytical techniques except for early SEM analysis at Dupont and use of the Photovolt 5. The work presently under way by Jonathan Amey, using diode array technology, calibrated against a visual standard evaluated by a group of 10 trained observers, shows results that are just below the accuracy of a group of observers. If this work progresses, the technology has the potential to surpass a group of trained visual observers. 6. Porosity measurements included Bendtsen air porosity, bubble count method (diameter of 10% largest pores), and measurement of the average diameter of the 35 largest pores). All tests were performed at the Institute for Paper Chemistry, Appelton, Wisconsin, now the Institute of Paper Science and Technology, University of Georgia, Athens, Georgia. 7. Calculations of mean fiber length and width were performed using a Zeiss microscope at 40x. 8. It should be noted that these results were obtained following a specific wetting and drying history. Each sample had passed through immersion (saturation), air drying, oven drying, equilibrium for several weeks in laboratory conditions, followed by prolonged exposure to high relative humidity. Prior history of mositure gain and loss affects moisture regain capacity as well as other part properties. 9. The insight into the water vapor-aluminum interaction was provided by Timothy Padfield, then environmental specialist, Conservation Analytical Laboratory, Smithsonian Institution, Washington, D. C. Padfield is now a conservation scientist at the National Museum of Denmark, Lyngby, Denmark. REFERENCESArney, J. S., and J. R.Gammell. 1990. The interaction of light with objects of art: Aging and seeing. The Spectrum3(3):9–13. ASTM. 1982. D644–55. In 1983 Annual Book of ASTM Standards Section15, Vol. 15.09. Philadelphia: American Society for Testing Materials. Christiansen, P. K., and H. W.Giertz. 1966. The cellulose/water relationship. In Consolidation of the paper web, ed.F.Bolam. London: Technical Section, British Paper and Board Makers' Association. 1:59–89. Rance, H. F.1954. Effect of water removal on sheet properties. TAPPI Journal37(12):640–48. Robertson, A. A.1963. The physical properties of wet webs. Svensk Papperstidning66 (12):477–97. Robertson, A. A.1966. Measurement and significance of the water retention properties of paper-making fibers. In Consolidation of the paper web, ed.F.Bolam. London: Technical Section, British Paper and Board Makers' Association. 1:90–115. Robertson, A. A.1970. Interactions of liquids of liquids with cellulose. TAPPI Journal53 (7):1331–39.
Rowland, S. P.1979. Solid liquid interactions: Inter-and intracrystalline reactions in cellulose fibers. In Skelton, J.1975. Interfiber forces during wetting and drying. Science190 (4209):15–20. Sugarman, J.1985. The effect of different drying techniques on the surface qualities of paper. Unpublished manuscript. Winterthur Museum. Vitale, T. J. n.d. The effects of drying on the mechanical properties of paper and their relationship to the treatment of paper. In Materials issues in art and archaeology III. Materials Research Society Proceedings. eds.P. B.Vandiver, J. R.Druzik, G. S.Whecler, and I. C.Freestone. Forthcoming. Vitale, T. J. n.d. The effects of water on the mechanical properties of paper and their relationship to the treatment of paper. In Materials issues in art and archaeology III. Materials Research Society Proceedings. eds.P. B.Vandiver, J. R.Druzik, G. S.Wheeler, and I. C.Freestone. Forthcoming. Wink, W. A.1961. The effect of relative humidity and temperature on paper properties. TAPPI Journal44 (6):171A–80A. OTHER SOURCESAtalla, R. H.1981. The crystallinity of cellulosic fibers. Dependece on history and influence on properties. In Preservation of paper and textiles of historic value II. Advances in Chemistry Series 193. Washington, D. C.: American Chemical Society. 169–76. Byrd, VonL.1971. The effects of humidity on paper. Forest Products Department, U. S. Department of Agriculture, Chem 26. 30–35. Corte, H. K.1976. Perception of the optical properties of paper. In The fundamental properties of paper related to its uses, ed.F.Bolam. London: Technical Section. British Paper and Board Makers' Association. 2:709–11. Corte, H. K.1982. The porosity of paper. In Handbook of paper science: The structure and physical properties of paper, ed.H. F.Rance. Amsterdam: Elsevier Scientific Publishing Company2:1–70. Daisley, P. A.1976. Quantification of subjective quality. In The fundamental properties of paper related to its uses, ed.F.Bolam, London: Technical Section, British Paper and Board Makers' Association. 2:709–11. Gallay, W.1976. Textural properties of paper: Measurements and fundamental relationships. In The fundamental propertics of paper related to its uses, ed.F.Bolam. London: Technical Section, British Paper and Board Makers' Association. 2:684–95. Hemadi, S., J.Huszar, and P.Lengyel. 1977. Interactions between liquids and paper [Shortened version of the original article, prepared by R. W. Hoyland, University of Manchester Institute of Science and Technology, Manchester.] In Transactions of BPBIF symposium (Oxford): Fiber-water interactions in paper making. London: The British Paper and Board Industry Federation. 693–707. Page, D. H., and P. A.Tydeman. 1962. A new theory of the shrinkage, structure and properties of paper. In The formation and structure of paper: Transactions of the symposium held at Oxford, September 1961, ed.F.Bolam. London: Technical Section, British Paper and Board Makers' Association. 397–421. PageD. H., and P. A.Tydeman. 1966. Physical processes occurring during the drying phase. In consolidation of the paper web, ed.F.Bolam. London: Technical Section, British Paper and Board Makers' Association. 1:371–96. Robertson, A. A.1964. Some observations of the effects of drying papermaking fibers. Pulp and Paper Magazine of Canada65:161–68. Rowland, S. P.1977. Cellulose: Pores, intermal surfaces, and the water interface. In Textile and paper technology, ed.J. C.Arthur. Advances in Chemistry Series 49. Washington, D. C.: American Chemical Society. 20–45.
Scallon, A. M.1976. The accommodation of water within pulp fibers. In The fundamental properties of paper related to its uses, ed.F.Bolam. London: Technical Section, British Paper and Board Makers' Association. 1:9–29. Scallon, A. M., and J.Borch. 1976. Fundamental parameters affecting the opacity and brightness of uncoated paper. In The fundamental properties of paper related to its uses, ed.F.Bolam. London: Technical Section, British Paper and Board Makers' Association. 1:152–71. Setterholm, V. C., and W. A.Chilson. 1965. Drying restraint. TAPPI Journal48 (11):638–40. Stamm, A. J.1950. Bound water and hydration. TAPPI Journal33 (9):435–39. Stone, J. E., and A. M.Scallon. 1966. Influence on drying on the pore structures of the cell wall. In Consolidation of the paper web, ed.F.Bolam. London: Technical Section, British Paper and Board Makers' Association. 1:145–73. AUTHOR INFORMATIONJANE E. SUGARMAN is a paper conservator in private practice in Greensboro, North Carolina. She is a 1986 graduate of the University of Delaware/Winterthur Art Conservation Program. As a National Museum Act fellowship recipient, she spent two years working with Christa Gaede in her private practice in Arlington, Massachusetts. Address: 512 South Elm St., Greensboro, N. C. 27406. TIMOTHYJ. VITALE is senior paper conservator at the Conservation Analytical Laboratory, Smithsonian Institution. He has a B. S. in art history from San Jose State University, San Jose, CA, 1973, and a M. S. in art conservation from the University of Delaware/Winterthur Art Conservation Program, 1977. He was a staff member at the Stanford University of Museum, 1970–74 and served an apprenticeship with Sella Petri, a book conservator in San Francisco. He was head of paper conservation, Intermuseum Conservation Association, Oberlin, OH, 1978–82, and chief of presevation branch, National Archives and Records Service, Washington, D. C., 1982–83. Since 1983 he has been at the Conservation Analytical Laboratory. He was president of the AIC Book and Paper group from 1982–84, and served on the AIC certification and accreditation committee 1981–86. Address: Conservation Analytical Laboratory, Smithsonian Institution, Washington, D. C. 20560.
 Section Index Section Index |