PHOTOLUMINESCENCE SPECTROSCOPY OF NATURAL RESINS AND ORGANIC BINDING MEDIA OF PAINTINGSLONDA J. LARSON, KYEONG-SOOK KIM SHIN, & JEFFREY I. ZINK
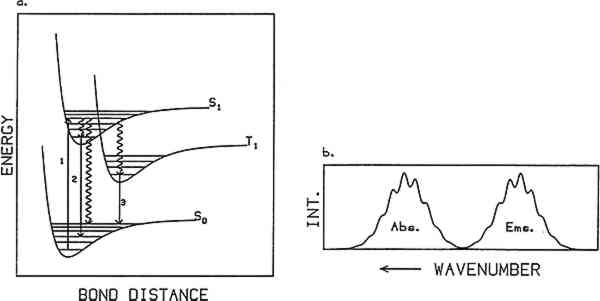
ABSTRACT—The photoluminescence spectra of a variety of natural resins and organic binding media used on paintings are reported. A few mixtures of these materials with one another and with pigments were also studied. The application of this technique toward the identification of these materials is considered. Both bulk materials and films prepared from selected bulk materials were studied, and a comparison is made between the bulk and film samples. Temperature and excitation wavelength studies are reported and discussed for several of the samples. 1 INTRODUCTIONLUMINESCENCE SPECTROSCOPY is a well-developed and powerful technique for studying molecular properties. In addition to its applications in chemical analysis, the technique can be used to study spatial distribution of microscopic materials in a macroscopic object and molecular changes that occur as a function of time. Luminescence spectroscopy can be used, for example, to measure spectra from samples with dimensions of as small as 1 micron. This spatial resolution makes it possible to measure spectra from very small regions of a large object as well as from very small pieces of an object. Chemical changes that occur in an object can be studied as a function of time. Slow changes that occur over a period of years as well as faster changes that occur within fractions of a second can be measured. It has long been recognized that ultraviolet light can be used to study painting materials (Rorimer 1931; Radley and Grant 1959). Irradiating a painting with an ultraviolet lamp can cause portions of it to luminesce. Different substances may show different luminescence characteristics, such as different color and intensity. Thus it may be possible to determine the composition of painting layers with this technique. Surprisingly, detailed studies of the luminescence properties of substances used on paintings have been limited, but increasing attention is being given to this technique. E. Ren� de la Rie has made impressive progress in analysis of the luminescence properties of some natural resins, linseed oil, some pure pigments and pigments in the presence of linseed oil (de la Rie 1982a–c). These studies employed a traditional fluorescence spectrometer using a mercury discharge lamp as the excitation source. In further studies, T. Miyoshi and co-workers(1982, 1985) excited samples of poppy and linseed oil as well as various pigments with a pulsed nitrogen laser, and A. Wallert (1986) examined the fluorescence of quinone, lichen, and redwood dyestuffs using a xenon lamp excitation source. More recently, B. Guineau (1989) used the combined techniques of laser-induced Raman and fluorometric microanalysis to study organic dyes and pigments. The purpose of the studies reported here is to test the feasibility of applying luminescence techniques to the identification of actual painting materials. Specifically, this article surveys a large number of natural resins and organic binding media used on Table 1 Luminescent Samples Studied Using Laser-Induced Luminescence Spectroscopy Table 2 Films Cast from Solutions of Slected Bulk Maerials from Table 1 and Studied Using Laser-Induced Luminescence Spectroscopy1 For those unfamiliar with photoluminescence, a simplified description of the theory is given before discussion of the experimental configuration and the results of this survey. The reader is referred to the literature for more detailed information (Turro 1978). 2 PHOTOLUMINESCENCE SPECTROSCOPYPHOTOLUMINESCENCE SPECTROSCOPY is based on the emission of light from matter following excitation by light absorption. Figure 1a illustrates a simplified energy state diagram depicting the process. Energy versus bond distance is plotted for the ground state and the two lowest excited states of a molecule. The curves labeled S0, S1, and T1 represent stable electronic energy states of the molecule. S0 is the ground electronic state, S1 the first excited singlet state, and T1 the first excited triplet state. Within each electronic energy state are a series of vibrational states represented by horizontal lines. The typical energy spacing between electronic energy states is in the ultraviolet and visible region of the electromagnetic spectrum (between 50,000 cm−1 and 12,500 cm−1 or
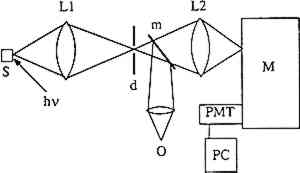
Absorption generally occurs from the lowest vibrational state of the ground electronic state. Typically the ground state is singlet in character (S0), that is, all electrons in the molecule have their spins paired, and from spin conservation rules absorption occurs into an excited singlet state (e.g., S1). Once a molecule is promoted to an excited electronic state it can follow one of three competing paths to release its excess internal energy: heat loss (radiationless decay), molecular decomposition (photochemical reaction), or radiative decay (luminescence). When relaxation occurs through heat loss, the molecule loses its excess energy through energy transfer to its surroundings. The loss of energy through molecular decomposition yields a new molecule. Radiative decay occurs when the molecule returns to its ground state by emitting a photon. Not all materials give measurable luminescence because the competitive relaxation pathways of radiationless decay or sample decomposition predominate. Emission usually occurs from the lowest vibrational state of the lowest excited electronic state of a given spin multiplicity. Thus after absorption takes place the molecule relaxes down to this level via energy transfer to its surroundings. This loss of energy is the reason an emission spectrum is at lower energy (i.e., longer wavelength) than the absorption spectrum for a particular molecule. When emission occurs from a singlet excited state to a singlet ground state, the phenomenon is called “fluorescence” and exhibits lifetimes on the order of nanoseconds (10−9 seconds) or less. If the molecule relaxes into an excited triplet state and then emits, the radiative phenomenon is called “phosphorescence.” This type of transition can have a lifetime ranging from milliseconds to seconds. While fluorescence may often be observed at room temperature, phosphorescence is usually observed only at low temperatures where the rates of the nonradiative decay processes are decreased. The generic term “luminescence” is used to refer to both of these radiative processes. A luminescence or emission spectrum is a plot of the intensity of light emitted as a function of wavelength or energy. Typical units are nanometers and wavenumbers (reciprocal wavelength in units of cm−1), respectively. The wavelength or wavenumber of maximum intensity and the full width at half maximum (fwhm) of an emission spectrum are important characteristics of the spectrum. If the vibrational bands in the ground state are resolved, the observed emission will show vibronic structure as illustrated in figure 1b. If the vibrational states are not resolved, the emission will be a broad envelope. Typically, the overall band shape for an emission spectrum of a pure molecular sample consists of a sharp rise in emission intensity on the high-energy (low-wavelength) side of the peak, with a more gradual decrease on the low-energy side. Different band shapes are often observed in spectra of samples that consist of more than one emitting component. In this case, the overall shape of the emission spectrum depends on the relative concentrations of the emitting species and their relative quantum yields. Additionally, a one-component sample rarely exhibits excitation wavelength-dependent emission because emission is observed only from the lowest excited state of a given spin multiplicity. In a multicomponent sample, however, different components may be excited selectively by varying the excitation wavelength, resulting in an excitation wavelength-dependent emission. Several features can characterize the luminescence spectrum from a sample. They are the fwhm of the spectrum, the shape of the spectrum, the wavelength (or wavenumber) of 3 EXPERIMENTAL PROCEDURETHE MEASUREMENT of luminescence spectra requires four pieces of equipment: a light source for excitation of the sample, a device to disperse the emitted radiation by wavelength, a detector, and a recorder. Samples were provided by the Getty Conservation Institute (GCI) and analyzed by laser-induced luminescence spectroscopy. Figure 2 illustrates the experimental configuration. Samples were mounted on a copper block inside a Displex closed-cycle helium refrigeration unit equipped with a thermocouple and a heater. The temperature could be varied continuously from room temperature to 10K. A continuous-wave argon-ion laser served as the excitation source. The laser beam was focused onto the sample, which absorbed the light. Emission from the sample was collected at approximately 45� from the laser beam, sent through a Spex model 1702 3/4-meter single monochromator, and then detected by an RCA C31034 photomultiplier tube. The signal from the photomultiplier tube was processed through an EG&G model 1105 photon counter and stored digitally in a computer. In practice, the sensitivity of the instrument varies with wavelength, causing distortions in the spectra, and spectra are usually reported as either “uncorrected” or “corrected” for instrumental response. The spectra shown in this article were corrected for instrumental response.
The materials studied are listed in table 1. The materials were previously characterized by infrared spectroscopy at the GCI. The bulk materials were in the form of either lumps or powders. Several samples dated to the 1930s, obtained from the Fogg Art Museum, Harvard University, were included in the study. Some of the Fogg samples were in the form of films cast onto glass from solutions of the bulk material. These films were removed from the glass substrate and studied as powders mounted on the copper block. In addition, several films were cast of selected modern bulk materials, either from turpentine, mineral spirits, ethanol, or water solutions of the materials. The films, listed in table 2, were cast onto aluminum foil from 5% solutions after filtration through one layer of cheesecloth. Only the soluble and partly soluble materials were cast as films and then studied. A film sample of manila copal dated 1920–23 was also prepared. In all cases, In the experiments performed, samples ranged from a few millimeters to about 150 microns in size, while the spatial resolution of the laser beam was approximately 100 microns in diameter. However, spatial resolution on the submicron level is possible (Salath� and Gilgen 1985). In principle, laser-induced luminescence spectroscopy is nondestructive, but sample decomposition may occur if excessive heating or photochemical reactions take place. For the samples studied, it was possible to obtain emission spectra without decomposing the sample. The spectra shown in figures 3–11 were all normalized to 100. Thus the plotted intensities are in units of percent of the intensities of the peak maxima. The samples studied tended to exhibit broad emission maxima. The estimated uncertainty in determining the maxima for such broad peaks is �100 cm−1. Peak widths are reported with the same uncertainty.
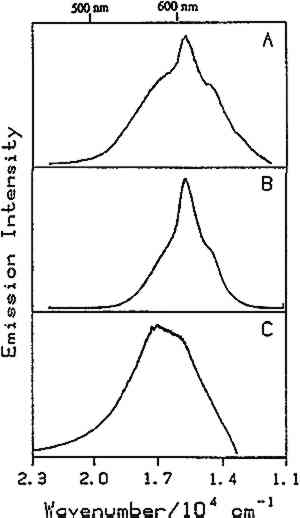
4 RESULTS AND DISCUSSIONPREVIOUS WORK has focused on the luminescence of dyes and pigments, natural resins, binding materials, and mixtures of linseed oil with pigments (de la Rie 1982a–c; Miyoshi 1982, 1985; Wallert 1986; Guineau 1989; Tutt 1984). Ideally, one would like to be able to distinguish among various pigments, coatings, and binding materials in the presence of one another. Many different samples were studied, including natural resins, waxes, drying oils, proteinaceous materials, and gums as well as a few mixtures of these materials with one another and with pigments. Tables 1 and 2 list the samples studied spectroscopically in the authors' laboratory to date. Emission spectra were taken of all of the samples listed in table 1 at room temperature. In addition, several of the bulk samples as indicated in table 1 were studied at low temperatures (10K–25K). Except for dragon's blood, orange shellac (fig. 6), lemon shellac, and dewaxed, decolored shellac, all of the bulk samples exhibit broad, relatively featureless emission spectra at room temperature. For the bulk samples that were studied at low temperature, it was found that bleached beeswax (fig. 10), in addition to dragon's blood and the shellacs, exhibits structure in its emission spectrum at low temperature. Emission spectra of the films listed in table 2 were taken at low temperature (20K–25K). Several of the films, including films of elemi (fig. 11), sandarac, dragon's blood, bleached beeswax, and the shellacs, show structure to varying extents in their low-temperature emission spectra. A room-temperature spectrum of the orange shellac film cast from an ethanol solution was also obtained (fig. 6). Each The following discussion is divided into six parts:
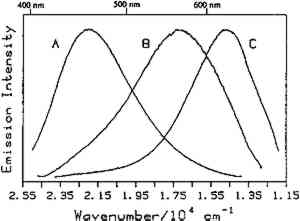
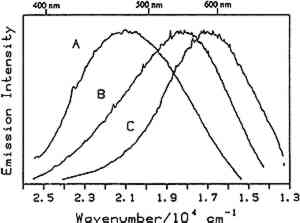
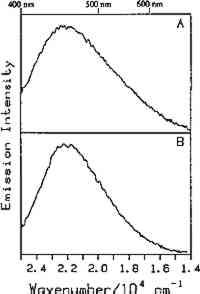
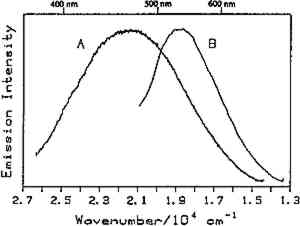
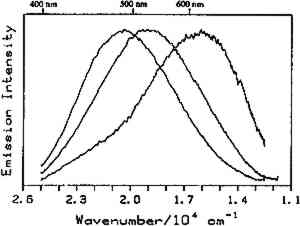
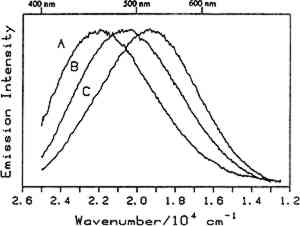
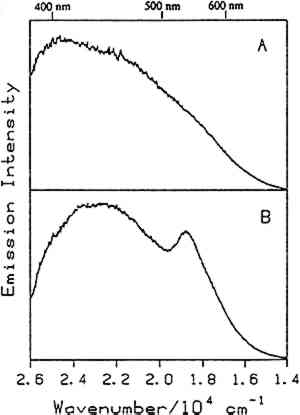
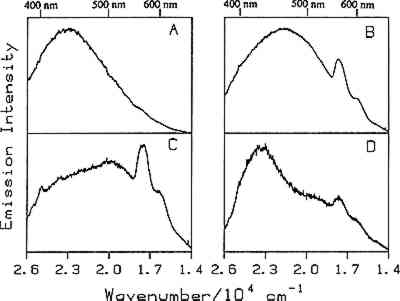
4.1 BINDERSRoom-temperature spectra taken by using 363.8 nm excitation of three of the binders studied—aged linseed oil (ca. 1934), aged egg yolk (ca. 1937), and bulk casein—are shown in figure 3. The emission maxima are well separated. The maximum emission in the luminescence spectrum of casein is at 21,900 cm−1, that of egg yolk is at 17,200 cm−1, and that of linseed oil is at 14,600 cm−1. Luminescence spectroscopy can thus nondestructively differentiate among these samples by the positions of their emission maxima. A second spectral feature that can be used in conjunction with the peak maxima to differentiate among these samples is the peak width. The fwhm of the peaks are 4700 cm−1, 5600 cm−1, and 4200 cm−1 for casein, egg yolk, and linseed oil, respectively. The spectrum of casein shows a typical luminescence peak shape for a large organic molecule. It rises sharply on the high-energy side and has a longer tail on the low-energy side. In contrast, the spectra of both the linseed oil and the egg yolk are not typical of luminescence from a single component; both spectra have long tails on the high-energy side of the peak. The tail is characteristic of emission from one or more components that emit to the high-energy side of the most intense peak. The room temperature spectrum of a modern sample of linseed oil (aged one year) also exhibits an emission spectrum characteristic of a multicomponent sample. The emission from the modern sample peaks at 20,300 cm−1. This emission is shifted to higher energy compared to the aged sample's emission by 5,700 cm−1 and is consistent with de la Rie's findings (1982b) that the luminescence of linseed oil shifts to lower energy as the oil ages. Care should be taken in this comparison, however, since the conditions under which linseed oil ages have been shown to contribute to both the intensity and the position of the emission (de la Rie 1982b). 4.2 BINDERS IN THE PRESENCE OF LEAD WHITEIt is important to determine whether or not binders luminesce in the presence of pigments. de la Rie has shown (1982c) that lead white (2PbCO3.Pb(OH)2) appears to accelerate the production of the emitting species in linseed oil (the fresh oil does not luminesce). He has suggested two possible mechanisms that could lead to this effect. First, the cause may be the accelerating effect of Pb metal on the drying process of the oil, which accelerates the production of luminescent degradation products. Alternatively, the metal may influence the luminescence of the degradation products formed as the oil ages 4.3 DIFFERENT MATERIALS WITH SUBTLE DIFFERENCES IN SPECTRAThe position of the peak maximum may not always provide a reliable means of differentiating among materials. For example, the room-temperature luminescence spectra of gum tragacanth and gum arabic excited at 363.8 nm maximized at 22,200 and 22,100 cm−1, respectively, and are very similar in shape, as shown in figure 5. The similarity of the spectra should not be construed to mean that the structure of the materials is similar. The biogenesis of each gum appears to be quite different, and the ratio of their neutral monosaccharides, arabinose and galactose, are widely different (Twilley 1984). Therefore chemical characterization remains superior to characterization by room-temperature luminescence with ultraviolet excitation, and caution should be taken in trying to distinguish these materials by using the emission spectra taken at the one excitation wavelength and temperature. The emission from both of these samples shifts to higher energies when the temperature is lowered to 10K. However, the spectrum of gum tragacanth, with an emission maximum at 24,000 cm−1 at 10K, shifts to a greater extent than that of gum arabic, which peaks at 22,800 cm−1 at 10K. As previously indicated, the instrument is also capable of varying the excitation wavelength to provide a multidimensional picture. These two experimentally controllable factors along with the characterization of the luminescence lifetimes may provide a method for distinguishing these two materials. 4.4 NATURAL RESINSThe luminescence spectra of 15 natural resin samples, including dammar, mastic and sandarac (tree resins), copal (fossil resin), shellac (insect derived), and rosin (resin from balsam distillation), were obtained and studied. These spectra proved particularly revealing not only of the power of luminescence spectroscopy but also of the properties of the samples. In this section, four aspects of the spectra are illustrated and discussed. First, differentiation between some of the resins will be discussed. Second, the dependence of the spectra on the wavelength of excitation is used to show how the technique can be employed to selectively excite specific components of a multicomponent system. Third, the spatial resolution of the technique is used to show that an ostensibly pure sample is actually spatially inhomogeneous. Finally, the technique reveals spectroscopic differences that may be caused by differences in the sample source or by chemical changes that 4.4.1 Spectroscopic DifferentiationOf the 15 resins studied, dragon's blood and the shellacs can be easily differentiated from the others. The emission observed using ultraviolet excitation from each of these samples is further to the red, peaking between 15,000 and 18,000 cm−1, than the emission observed from the other resins studied. Thus they exhibit emission maxima clearly different from those observed with the other resins (figs. 7–9, 11), which emit farther to the blue. In addition to luminescing further to the red, both the bulk and film samples of dragon's blood and the shellacs show structure in their spectra. Figure 6 illustrates the structure observed in the emission spectrum of orange shellac. The origin of the structure was not thoroughly investigated, but it is most likely due to multiple emissions as opposed to being of vibronic origin. 4.4.2 Effect of Excitation Wavelength on SpectraThe excitation wavelength dependence of luminescence can be useful in characterizing the resins. As discussed previously, a one-component sample rarely exhibits wavelength dependence. However, a multicomponent sample may show wavelength dependence. As a simple example, consider a material made up of two different components: component A, which absorbs at 351.1 nm, and component B, which absorbs at both 351.1 nm and 457.9 nm. Irradiation of the material at 351.1 nm excites both components. Thus under these conditions luminescence is observed from both components. However, irradiation of the material at 457.9 nm only excites component B. Thus under these conditions luminescence is observed only from component B. Our excitation wavelength dependence experiments indicate that the materials called sandarac, dammar, copal, rosin, and mastic consist of more than one luminescent component. Figure 7 illustrates the specific effect of excitation wavelength on the luminescence of sandarac. As the excitation wavelength moves toward lower energy, the peak maximum shifts to lower energy. This behavior indicates that sandarac has multiple components that absorb and emit at different wavelengths. 4.4.3 Spatial InhomogeneitiesLaser-induced luminescence is a powerful technique for detecting inhomogeneities and determining the spatial distribution of the components of a sample. For example, figure 8 shows three different emission spectra from three different 100-micron regions of the same sample of what is purported to be manila copal dated 1920–23. Widely different spectra were observed, with emission maxima ranging from 16000 cm−1 to 20400 cm−1. A conventional luminescence spectrometer with a mercury discharge lamp as the excitation source does not allow the fine spatial resolution that can be achieved when using a laser. Using a conventional spectrometer, the spectra of the sample of manila copal might appear as a superposition of the spectra shown. The major components of bulk dammar, mastic, and rosin luminesce at room temperature under 363.8 nm excitation with band maxima at 22,000 cm−1, 20,600 cm−1, and 19,300 cm−1, respectively. Spectra from these samples are shown in figure 9. However, small regions of the samples could be found in which the band maxima were shifted from those in figure 9. Thus in the samples with closely spaced emission maxima the presence Chemical changes that occur with aging might be expected to cause spatial inhomogeneity in a sample. We have noted that the naturally aged resins obtained from the reference collection at the Fogg Art Museum, Harvard University, show spatial inhomogeneity to varying extents. The effects of the atmosphere would be predominant on the surface of and in cracks on a sample. Luminescence spectroscopy can probe the spatial location of these processes. 4.4.4 Effects of Sample Source or AgingThe effects of sample origin and/or aging are exemplified in figure 6. All three spectra shown are of orange shellac. Figure 6a is a spectrum of a modern bulk sample. The emission spectrum shown in figure 6b was taken from a modern film cast from an ethanol solution of the same bulk material source as used to take the spectrum shown in figure 6a. Figure 6c is the spectrum of an aged film cast from ethanol. Both the modern bulk and modern film samples exhibit emission peaks or shoulders at 16,500, 15,800, and 14,700 cm−1, but the relative intensities of these features are different between the bulk and the film spectra. The aged film shows only two features in its emission spectrum; a peak at 17,000 cm−1 and a shoulder at 16,000 cm−1. The emission spectrum of the aged orange shellac film is shifted to slightly higher energies with respect to the newer sample. This finding is contrary to de la Rie's finding (1982b) that the emission from resins tends to shift to lower energies with age. Again, care must be taken in these comparisons since the conditions under which the sample was aged will contribute to its luminescence characteristics. The differences between the spectra of the modern and aged films are probably related to chemical differences between 6b (ca. 1988) and 6c (ca. 1932), either caused by changes that occur during aging or by differences in the sample source. 4.5 TEMPERATURE EFFECTSStudies of the temperature dependence of the luminescence showed that the intensity increased with decreasing temperature. This increase is due to a decrease in the rate of nonradiative decay. One advantage in using a low temperature is to increase the signal-to-noise ratio. For the resins orange shellac, copal, rosin, sandarac, mastic, and dammar the intensities increased approximately tenfold on going from room temperature to 10K. A second advantage in using low temperature is that, in general, the quantum yield of phosphorescence is increased to a greater extent relative to fluorescence. For many compounds phosphorescence is absent at room temperature but easily detected at low temperatures. New phosphorescence bands that may grow in at low temperatures may be useful in identifying materials. Bleached beeswax (fig. 10) is an example of a sample that not only shows an intensity increase at low temperature but also exhibits this effect of new bands growing in at low temperature. 4.6 COMPARISON OF BULK AND FILM SAMPLESComparison of bulk and film samples allows the evaluation of differences that result from solvation of the different components that make up the bulk materials. Comparisons were made between bulk and film sample spectra taken at the same temperature. In general, the film samples had luminescence spectra with larger fwhm than the corresponding bulk materials. In some cases only one solvent was used and compared to the bulk, while in other cases three different solvents were used (table 2). When one solvent was used, little difference was observed between the bulk and film samples of the shellacs, bleached beeswax, and the copals. The peak positions for the bulk shellacs and bulk beeswax were the same as in the corresponding films. For orange shellac, different relative intensities of the peaks were observed in the bulk as compared to the film material. This comparison is shown in figure 6a–b. For bleached beeswax the relative peak heights could not be easily compared due to inhomogeneities detected in both the bulk and film samples. The bulk copals were inhomogeneous, but parts of the bulk samples looked similar to the film. In the case of gum tragacanth and gum arabic, the overall shape of the bulk and film spectra were similar, but the films show maxima that were red shifted by 700 and 1,200 cm−1 for gum tragacanth and gum arabic, respectively, compared to the bulk. The multisolvent cases yield several interesting observations. Dammar and rosin films showed slightly solvent-dependent emission maxima, although the overall shape of the spectrum changed little between the bulk and the different film samples. Mastic and sandarac, in addition to showing solvent-dependent maxima, also exhibited slightly different band shapes depending on which solvent was used. Elemi and dragon's blood are more extreme cases where a large solvent effect was observed. Figure 11 shows this effect for elemi where the emission spectrum of the bulk sample along with films cast from turpentine, ethanol, and mineral spirits are compared. A total of five different bands can be observed in the film spectra. The bulk spectrum is a superposition of these various bands. The differences observed between emission from the bulk materials and various films could be attributed to selective solvation of components of the resin in a given solvent. Another possible explanation is related to the inhomogeneity of the bulk samples. Components within the bulk sample may not contribute to the luminescence because of self-absorption of the exciting or emitted radiation. These components could become more accessible after dissolution in a solvent. Solvent retention or the reaction of the solvent with the material may also contribute to the observed differences to some extent. 5 CONCLUSIONSA LARGE selection of materials are luminescent, including natural resins, waxes, oils, proteinaceous materials, gums, and mixtures of these materials. Luminescence can easily be detected and recorded from 100-micron regions of all the materials studied. In some cases, the luminescence peak maximum can be used to differentiate between samples. Additionally, the measurements demonstrate that changes in the wavelength of excitation and the sample temperature can cause spectral changes that may also be useful. Spatial inhomogeneities of materials can also be studied. To completely assess the utility of the technique, emission lifetimes as well as studies of wavelength dependences and temperature effects should be made. Further investigations should also explore in more detail the properties of mixtures of binding media with one another and with pigments. ACKNOWLEDGEMENTSTHIS WORK was made possible by a contract from the Getty Conservation Institute. The authors thank Michele Derrick, James Druzik, Frank Preusser, and Max Saltzman for helpful discussions. REFERENCESde la Rie, E. R.1982a. Fluorescence of paint and varnish layers (part 1). Studies in Conservation27:1–7. de la Rie, E. R.1982b. Fluorescence of paint and varnish layers (part 2). Studies in Conservation27:65–69. de la Rie, E. R.1982c. Fluorescence of paint and varnish layers (part 3). Studies in Conservation27:102–8. Guineau, B.1989. Non-destructive analysis of organic pigments and dyes using Raman microprobe, microfluorometer or absorption microspectrophotometer. Studies in Conservation34:38–44. Miyoshi, T.1982. Laser-induced fluorescence of oil colours and its application to the identification of pigments in oil paintings. Japanese Journal of Applied Physics21:1032–36. Miyoshi,T.1985. Fluorescence from oil colours, linseed oil and poppy oil under N2 laser excitation. Japanese Journal of Applied Physics24:371–72. Radley, J. A., and J.Grant. 1959. Fluorescence analysis in ultraviolet light. New York: Van Nostrand. Rorimer, J. J.1931. Ultraviolet rays and their use in examination of works of art. New York: Metropolitan Museum of Art. Salath�, R. P., and H. H.Gilgen.1985. Laser generated microstructures. Applied Physics A37:121–38. Turro, N. J.1978. Modern molecular photochemistry. Menlo Park, Calif.: Benjamin/Cummings Publishing. Tutt, L. W.1984. Excited state distortions, bonding and photochemistry of organometallic compounds. Ph.D. Thesis Dissertation, University of California, Los Angeles. Twilley, J.1984. The analysis of exudate plant gums in their artistic applications: An interim report. In Archaeological Chemistry III, ed.J. B.Lambert. Advances in Chemistry Series 205. Washington D.C.: American Chemical Society. Wallert, A.1986. Fluorescent assay of quinone, lichen and redwood dyestuffs. Studies in Conservation31:145–55. AUTHOR INFORMATIONLONDA J. LARSON received her B.S. in 1984 from California State University, Hayward, and her Ph.D. in chemistry in 1989 from the University of California, Los Angeles. She was awarded an AA Research Assistant/Mentor Fellowship in 1989 and has been a University of California President's Postdoctoral Fellow in the Department of Chemistry at the University of California, Davis since 1990. KYEONG-SOOK KIM SHIN received her B.S. in 1982 from Seoul National University, Korea, and her Ph.D. in Chemistry from the University of California, at Los Angeles (UCLA) in 1990. She is currently a Postdoctoral Fellow at UCLA in the Department of Chemistry and Biochemistry and the Department of Materials Science. JEFFREY I. ZINK received his B.S. in 1966 from the University of Wisconsin, and his Ph.D. in 1970 from the University of Illinois where he worked as an NDEA Fellow from 1966 to 1969 and an Industrial Fellow from 1969 to 1970. He joined the faculty of the University of California at Los Angeles (UCLA) Department of Chemistry and Biochemistry in 1970 where he currently serves as professor. A member of the American Chemical Society, National Audubon Society, Phi Kappa Phi, Phi Lambda Epsilon, and Alpha Chi Sigma. He was awarded a UCLA Summer Faculty Fellowship in 1971, the Camille and Henry Dreyfus Teacher-Scholar Award in 1975, an Alexander von Humboldt Stipendium in 1979, the Herbert Newby McCoy Award in 1982, the Glenn T. Seaborg Award in 1983, and was a John Simon Guggenehim Fellow in 1988.
 Section Index Section Index |