FOURIER TRANSFORM INFRARED SPECTRAL ANALYSIS OF NATURAL RESINS USED IN FURNITURE FINISHESMichele Derrick
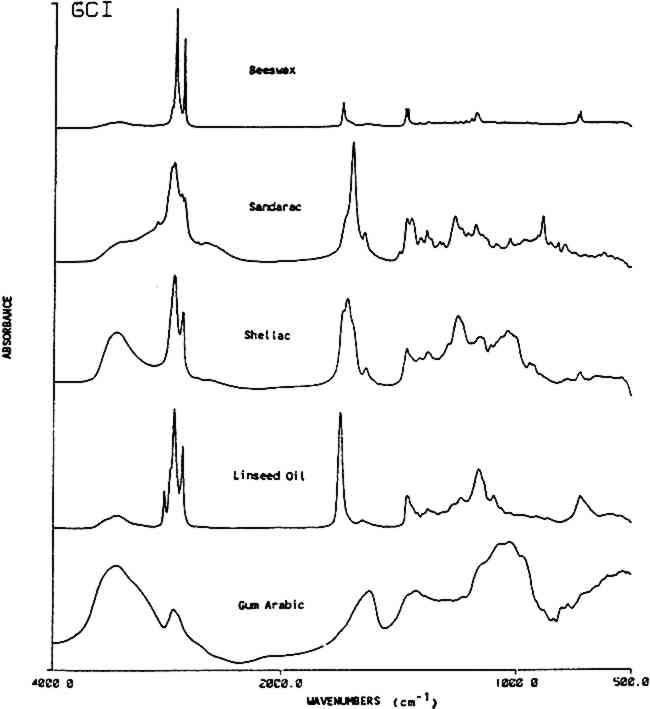
3 RESULTS AND DISCUSSION3.1 General ClassificationINFRARED SPECTROSCOPY PRODUCES a characteristic spectrum for any compound dependent on the functional groups that are present. For identification purposes, natural products may be grouped into the following classes that contain similar IR active functional groups: resins (tree), resins (insect), oils, gums and waxes. Table 1 shows these together with specific peak positions that occur within each material class. Figure 1 gives exemplary spectra of each category. The spectra of each of these classes are readily identifiable by their characteristic functional group vibrations. Typically OH stretches occur as broad bands near 3400 cm−1, methyl and methylene stretches occur in the region of 2800–3200 cm−1 and carbonyl bands are seen at 1690–1750 cm−1. The bands in the fingerprint region (below 1800 cm−1) are due to C-H, C-O and C-C wags and bends. The exact location (wavenumber) for each band depends on its molecular environment. More information on vibrational group assignments for these natural materials may be found elsewhere (Bellamy, 1968 and Omecinsky and Carriveau, 1986).
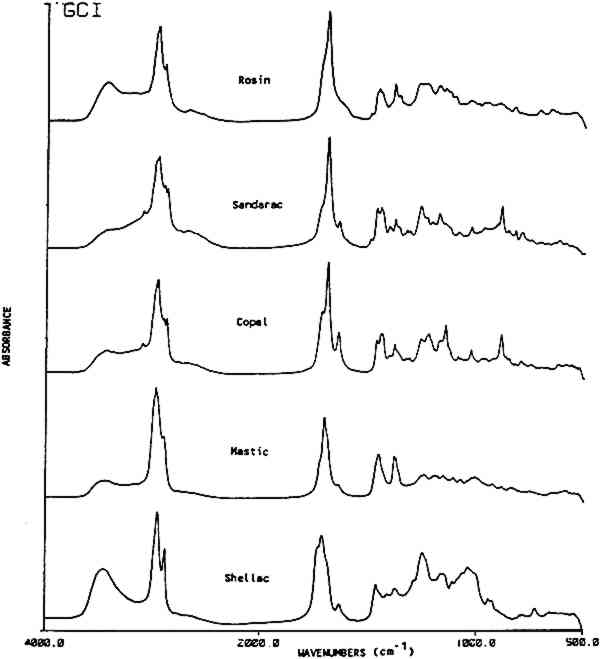
Table 1 This table lists characteristic absorption bands for several classes of natural materials. These bands appear consistently in the spectra of each class of material along with other bands, not in this list, which are specific to the individual types of materials found within each class. 3.2 Resin Identification KeyTable 2 gives an IR absorbance band identification key for five commonly used natural resins in furniture finishes along with their family name and major components. Additional information is included on the use of these resins in historic finishes. Figure 2 shows an infrared absorbance spectrum for each resin examined. Once a natural material has been classified as a resin using the information in Table 1, then the type of resin may be distinguished using the additional information provided in Table 2.
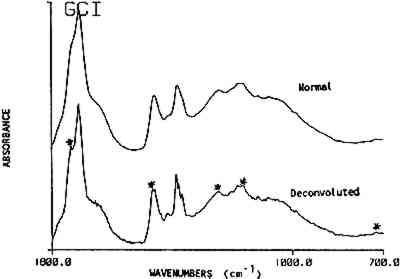
This key provides a simplified structure for the easy identification of the presence of a resin in a spectrum by a list of its absorbance band positions. The strongest bands in the resin spectra are generally the carbonyl and hydrocarbon stretching frequencies. These bands, listed at the top of the key can provide a distinction for four of the resins. Sandarac and copal are chemically and spectrally very similar and may 3.3 ReproducibilityThe premise of the identification of resins by band position alone is based on the assumption that the frequency of the absorption bands is reproducible. Several factors were examined individually to assess band position variability. They were: 1) instrument stability; 2) sample preparation methods; 3) source or degree of refinement of the resin; 4) sample size; 5) preparation of a varnish; and 6) the extent of deterioration or oxidation of the resin. A summary of standard deviations for the band position Table 3 Band Position Precision For Several Parameters Instrument stability was determined using the reference polystyrene film which had a precision of 0.1 cm−1 over a period of three years. Spectra were generated from a standard film using direct transmission which required no sample preparation. Reproducibility in sample preparation was then checked by preparing several pellets from the same batch of mastic resin which gave variations of 1.1 cm−1. Additionally, variations in wavenumber due to sample size were examined. Sandarac bands, using sample sizes ranging from 8 μg to 1.8 mg, were found to vary only 0.3 cm−1. This higher precision may be attributed to the sharper bands in the sandarac spectra or to the possibility that the sandarac bulk sample was more homogeneous than mastic. Differences due to the resin's source or supplier were checked by analyzing 8 mastic samples obtained from different suppliers. Additionally, 14 samples of shellac were analyzed, not only from different suppliers, but also with varying degrees of processing or refinement ranging from seedlac to dewaxed, decolored shellac. The band position reproducibility was 1.2 cm−1 for both sets of samples. Varnish preparation involved dissolution of the resins in a solvent, then filtration or sedimentation to remove insoluble fractions. Cast films of the resins prepared from different solvents gave an average variability of 0.8 cm−1. While some residual solvent was seen in the spectra of the films cast from turpentine, the spectra of the resins were still easily recognizable by their band positions. In general, spectra of the resins after solvation and filtration contained slightly sharper and better resolved bands than those prepared from the ground resins. Since finishes found on pieces of furniture in a museum may be of considerable age, the stability of the band positions in the IR spectrum of a resin as it deteriorates was considered. Naturally aged resin films obtained from the Gettens and Stout collection were analyzed, in addition to new resin films for which the photochemical deterioration process was accelerated by exposure to a xenon lamp. Overall, the naturally aged resins showed an average deviation of 1.3 cm−1, while the xenon light exposed resins showed a deviation of 2.1 cm−1. A comparison of the spectra of the naturally aged samples versus light and heat exposed samples will be covered in another paper (Derrick and Hansen, 1988). The most important factor for this paper is that the band positions are stable and may still be used to identify each of the resins after they have been degraded. 3.4 Resin MixturesUp to this point, reproducibility of the band positions has been demonstrated as a function of several variables. The resin identification method was then applied to resins in mixtures. Combinations of two or more resins are given in 80 recipes in Brachert's paper. In this study, resin mixtures were prepared in the proportions specified by six recipes. In addition, 44 mixtures of sandarac, copal, mastic, rosin After the infrared analysis of each mixture, a list of band positions was generated. The spectrum was then deconvoluted and a new band position list was generated. Only the deconvolution band positions were used in this resin mixture section. It was found that when a resin accounts for at least 50% of the total mixture a deconvolution step was unnecessary, i.e. all the bands required for the identification of the resin were present whether or not the spectrum had been deconvoluted. However, as the concentration of a resin decreased within the mixture, the deconvoluted spectrum consistently provided a higher proportion of the peaks necessary for an accurate identification of the resin. The 5 resins examined in the mixtures could be detected at concentrations as low as 2 w/w%. At these low levels, approximately half of the bands for a resin were present in the deconvoluted spectrum of the mixture. At resin concentrations above 6 w/w%, most (>90%) of its bands could be found in the deconvoluted spectra. Figure 3 shows a spectrum of mastic/oil film (Gettens and Stout collection, dated 1934, 5cc oil in 100cc ethanol with 33g mastic) before and after deconvolution. The bands specific for oil, visible only after deconvolution, are marked.
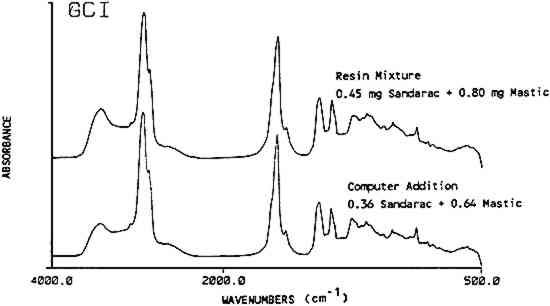
Copal was the one exception to the identification of a resin in a mixture by its band positions. The peaks used for the identification of copal and sandarac overlap Using mixtures of up to four components, it was apparent that the maximum number of resins that can be identified in one finish is probably four. More complex mixtures should be examined by another method, such as chromatography. 3.5 Spectral Subtraction and AdditionComputer assisted spectral subtraction techniques were employed to remove the major peaks in a mixture's spectrum revealing the presence of trace components. For one mixture containing 99.2 w/w% sandarac and 0.8 w/w% mastic, no mastic peaks were found in the deconvoluted spectra. Spectral subtraction of a known spectrum of pure sandarac was applied to the original spectrum, not on the deconvoluted spectrum, to remove 90% of the intensity of the sandarac-related bands. Afterwards the subtracted spectra were deconvoluted and examined for the presence of mastic bands. Half of the expected mastic bands were found confirming that mastic was indeed present. One problem can result in the subtraction spectra. Variations in line widths between the two spectra on which the subtraction is performed can result in negative baseline aberrations. In this case, a peak due to mastic may still not be present in the subtracted spectrum if it was close to a large sandarac peak. Alternatively, the peaks that do appear may be shifted outside the normally expected band range. This problem may be lessened by not subtracting the total amount of the major component. Actually, it only appears necessary to subtract enough of the major component to bring the minor component up to the equivalent of 10–20% composition. Another use for the computer is to synthesize spectra of resin mixtures via spectral addition methods. This procedure could be used to efficiently create a large reference set of spectra for typical furniture finish mixtures. This method was tested using a computer synthesized mixture of 64% of a mastic spectrum added to 36% of a sandarac spectrum in order to emulate a previously prepared mixture of 0.80 mg mastic and 0.45 mg sandarac. The spectrum for the actual mixture and the computer synthesized mixture corresponded well (Figure 4). A computer search using the Sadtler Library programs was made of the synthesized spectra versus this laboratory's library files consisting of over 300 natural and synthetic materials including all resin mixtures used in this study. The best match for the search was the actual resin mixture which the synthesized spectra were trying to emulate. The corresponding hit index was 0.0716 on a scale where 0.0000 is a perfect match and a typical match of 0.1500 is considered a good fit. In addition, mastic was a component in each of the ten best hits and sandarac was present in six of these. The search programs take the difference of the spectra in question versus the reference spectra and match according to the least differences. Computer synthesized spectra appear to be a viable, time saving alternative to manual preparation of resin mixtures.
3.6 Unknown samplesInfrared analysis was then done on samples taken from 18th century European furniture, even though it was unlikely that the outer layers sampled from the finishes contained the original resins. Samples from the exterior of two tables (72.DA.49, 84.DA.77), a cabinet (77.DA.91), a cupboard (72.DA.39), a commode (55.DA.5) and a desk (67.DA.10) were found to be shellac, while the finishes on a rolltop desk (72.DA.47), a double desk (70.DA.87) and a music stand (85.DA.216) were found to be mixtures of shellac and cellulose nitrate. Additional bands corresponding to oil were found on the rolltop desk, and another sample taken from the inside of a drawer on this desk was found to contain only shellac. For each sample the major components were identified, then the spectra were deconvoluted to check for minor components. This was followed by subtraction of the major component to further examine the spectra for minor components. According to Mattiello (1941), cellulose nitrate was often added to shellac in the 1930's and 40's to improve its water resistance. However, from these samples, it |