THE OZONE FADING OF TRADITIONAL NATURAL ORGANIC COLORANTS ON PAPERPaul M. Whitmore, Glen R. Cass, & James R. Druzik
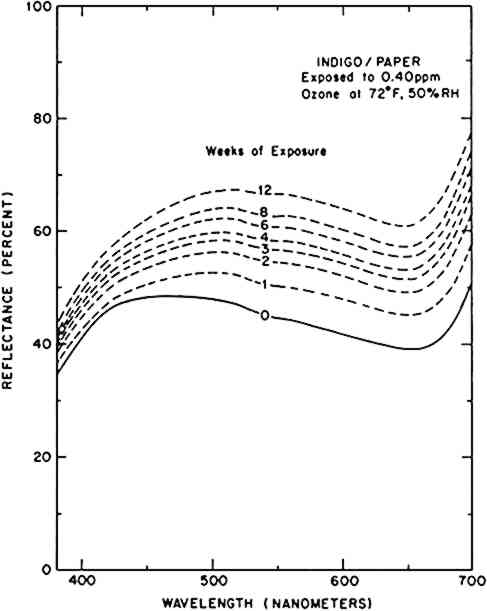
3 RESULTSTHE FADING OF AN OZONE-SENSITIVE colorant system can be characterized by the change in its visible reflectance spectrum upon exposure to ozone. Figure 1 illustrates the evolution of the reflectance spectrum of indigo on paper during its 12-week reaction with ozone. Indigo absorbs light across the visible spectrum, giving the indigo/paper system a bluish gray appearance. As the colorant is consumed (and presumably decolorized) by ozone, the reflectance across the visible spectrum increases, and the sample appears a lighter gray (i.e., faded). In this example, the wavelength of maximum reflectance also shifts from 450 nm (blue) to 500 nm (green) during the ozone reaction.
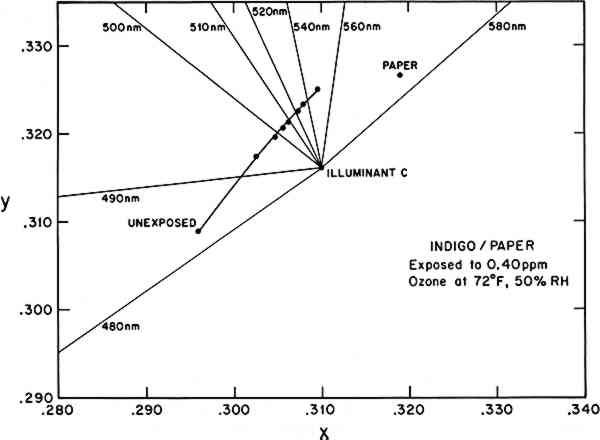
Although the reflectance spectrum contains all the information necessary to characterize the color during an ozone reaction, it is not the most convenient means to quantitatively assess or compare complicated color changes, which could involve shifts in hue as well as lightness. It is common, then, to reduce the spectral information to a set of parameters according to one of several conventions adopted for describing color.14Table 2 utilizes several of these methods to characterize the color under CIE Illuminant C during the ozone exposure of the indigo/paper sample whose reflectance spectrum is shown in Figure 1. Two frequently used color notations are the CIE tristimulus values (X, Y, Z) and the CIE chromaticity coordinates and luminous reflectance (x, y, Y). The chromaticity coordinates (x, y) also allow two-dimensional plotting and determination of such aspects of color as the dominant wavelength and purity under a standard illumination source. Figure 2 illustrates this use, showing the trend toward green (under Illuminant C) as the predominantly blue indigo/paper sample fades toward the yellow hue of the plain paper substrate. (Under this standard illuminant, the plain paper substrate appears yellow, and its color remains unchanged throughout the exposure. The observed yellowing of the indigo/paper sample during ozone exposure probably arises, at least in part, from the optical mixing of the yellow paper and the blue indigo. The possibility that some of this hue shift results from the generation of a yellow reaction product is the subject of further investigation.) Table 2 Observed color change in indigo/paper system during exposure to 0.40 ppm ozone at 72�F, 50% RH, in the absence of light. CIE tristimulus values (X, Y, Z) and CIE chromaticity coordinates and luminous reflectance (x, y, Y) are calculated for CIE Illuminant C from the measured reflectance spectra. Munsell color notations (hue, value/chroma) are calculated from the tristimulus values. Color differences, ΔE, are calculated using the CIE 1976 L∗a∗b∗ formula.
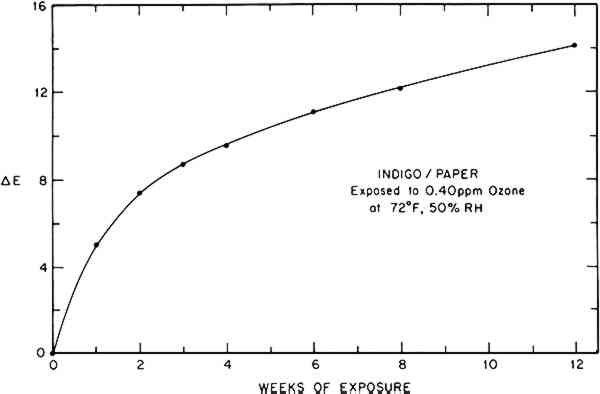
These parameters can also be used to calculate the Munsell notation for the color.15 This system denotes the color in terms of an average observer's perception of its hue, value (lightness), and chroma (saturation or purity). The Munsell description of the indigo/paper color change is easily interpretable in terms of its apparent shift in hue from blue toward green and an increase in its value or lightness. An added advantage of this approach is that a reported color can be visualized easily by referring to the appropriate color chips in the Munsell Book of Color.16 Finally, a single quantity representing the total perceived color difference between two specimens, combining changes in hue and lightness, can be calculated from two respective sets of tristimulus values.14 In this work the CIE 1976 L∗a∗b∗ formula has been used to determine the color difference, ΔE, of a colorant system before and after a given ozone dose, thus providing an approximate indicator of the magnitude or extent of the total color change caused by ozone reaction. (On the average, a ΔE value less than 0.5 is not perceptible, and a ΔE value less than 1 is usually considered a good color match.) The calculated color difference (vs. unexposed sample) during ozone exposure for the indigo/paper system is tabulated in Table 2 and illustrated graphically in Figure 3.
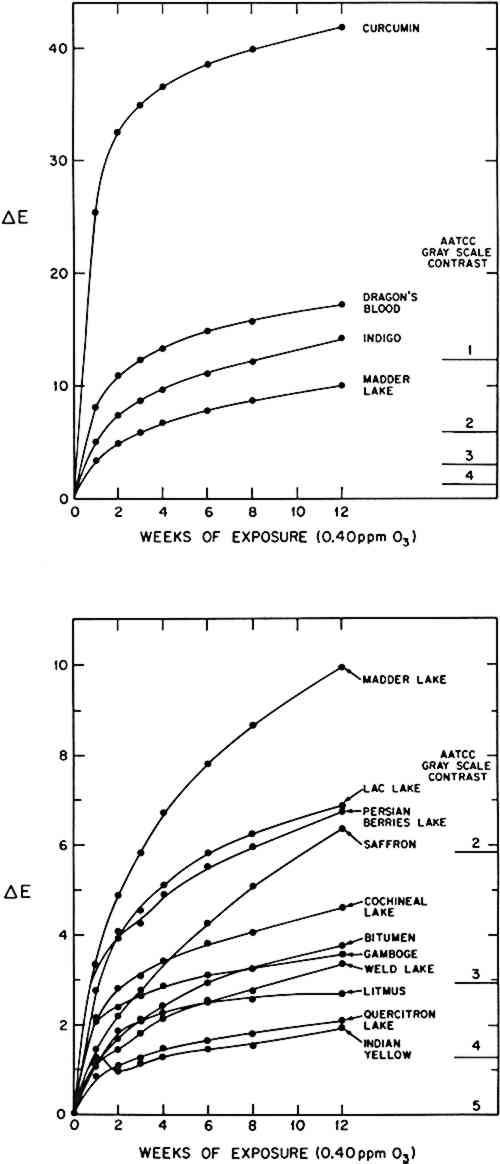
The results of the 12-week ozone exposure for the other natural colorant/paper systems are summarized in Table 3. Again, the reflectance spectra were measured, and the colors of the samples before and after exposure are described in terms of the calculated tristimulus values, chromaticity coordinates, Munsell notations, and color differences, ΔE. The time dependence of the color changes for all the colorant systems is shown in Figure 4. (For those colorants which were represented by samples from several sources, the results are reported for a typical example.) Table 3 Observed color change of natural colorant/paper systems upon exposure to 0.40 ppm ozone at 72�F, 50% RH, in the absence of light. CIE tristimulus values (X, Y, Z), chromaticity coordinates (x, y) and calculated Munsell notations (hue, value/chroma) for CIE Illuminant C are reported before and after the 12-week ozone exposure. Color differences between exposed and unexposed samples are calculated using the CIE 1976 L∗a∗b∗ formula.
|