PAPER COMPLEXITY AND THE INTERPRETATION OF CONSERVATION RESEARCHAntoinette Dwan
ABSTRACT—Paper variability and its influence on the methods of testing paper and the interpretation of test results is discussed. Variability of test data due to the composite and viscoelastic nature of paper, and moisture and temperature relationships is considered. Some topics covered are formation and furnish variability, the anisotropic nature of paper, network theories, preconditioning influences, and the hysteresis effect. Interpretation of test data is discussed with emphasis on the fold endurance test: its lack of precision, the wide variation in test results, and the possibilities for multiple interpretations. 1 INTRODUCTIONTHE TESTING OF MATERIALS and the interpretation of research are fundamental issues in paper conservation. This paper presents the properties of paper as a material and shows how paper variables relate to paper testing and the interpretation of research. Although paper degradation and its mechanisms and products are not fully understood, it is generally recognized that the chemical reactions of hydrolysis, oxidation, and cross-linking are involved. Physical properties associated with degradation are loss of strength, embrittlement, and loss of bonding within the paper matrix, among others. There are several options for testing either the chemical or physical properties of paper. Chemical testing methods provide information on the molecular level, while physical tests describe the total overall structure. Paper conservators are presented with explanations of chemical degradation processes, and should question why they are often measured using physical rather than chemical methods. Paper is a composite material: physical tests provide information about the integrated paper network rather than isolated contributing components. This is important because in addition to the chemical composition of the sheet, paper properties are dependent on the network matrix, the bonding within that matrix, and the fibers' properties responsible for the bonding. These categories are interrelated and within each, variables exist that affect the paper structure as a whole. The composite nature of paper limits the usefulness of testing isolated components, either chemical or physical. It is difficult to relate a single component back to the overall structure. The usefulness of chemical testing may be limited by lack of correlation to the overall physical structure of paper. Likewise, physical tests cannot provide information on a chemical reaction, or predict permanence. For example, loss of strength (a physical measurement) in a sheet of paper cannot be interpreted as resulting from the removal of cations (a chemical reaction) by wash water. The results of a particular test, chemical or physical, may be interpreted in a number of ways, and making the proper interpretations and conclusions depends upon the total research design and expertise of the researcher. Paper scientists use the combination of tests that fit their project design and that provide the necessary data to answer their specific inquiry. It is important to 2 PAPER AS A COMPOSITE MATERIAL“A COMPOSITE MATERIAL, although itself made up of other materials, can be considered to be a new material having characteristic properties which are derived from its constituents, from its processing, and from its microstructure.”1 Materials that are readily recognized as composites are metals, fiber glass, and laminated woods. Paper is a composite material, and its composite nature is a major factor in its wide variability.2 Within each fiber type there are differences in cell length, fibril angle, cellulose content, lignin content, and extractives chemistry. This variability is produced within the same tree due to factors such as early wood vs. late wood, juvenile vs. mature wood, and sapwood vs. heartwood, with additional effects from bark and other contaminates.3 Variability in properties due to variability in plant composition is also present in fibers such as flax, cotton, grasses, hemp, and jute.4 Most papers are composed of a combination of several fiber types. Additional variation is caused by variations in cooking (sulfate, sulfite, soda), bleaching, and refining (procedures for modifying the physical properties of the fibers, such as beating). The papermaking process induces variation in addition to that caused by differences in pulp stock composition. Using the same pulp but changing paper machine variables can produce papers with very different physical properties. For example, changing the machine speed alters the fiber orientation, resulting in different strength properties especially in the machine-direction and the cross-direction of the sheet. Various wet pressing conditions alter the density, porosity, optical, bonding, and strength values. Calendering affects surface and strength properties. Although the chemistry of several papers could be the same, the physical properties could be quite different resulting in very different papers. Composite variables are separated into two types: furnish (pulp composition) and formation (manufacturing). Furnish variables include the types of refining, the fiber sources and chemistry, the fiber dimensions (length, width, and fibril angle), furnish composition (ratio of fiber types), sizings, fillers, and coatings. Formation variables include the extent of beating, fiber direction, basis weight, wet pressing, drying, fiber distribution, and calendering.
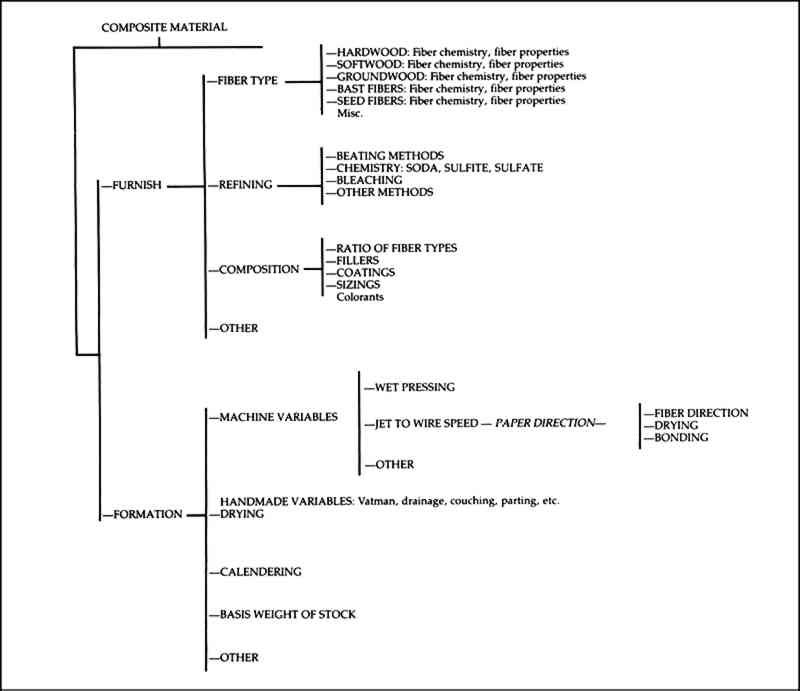
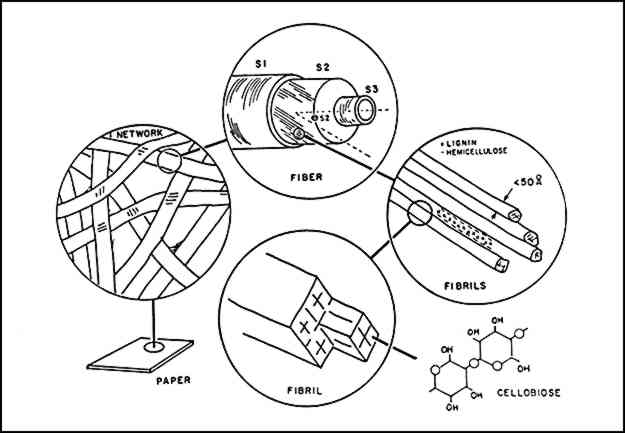
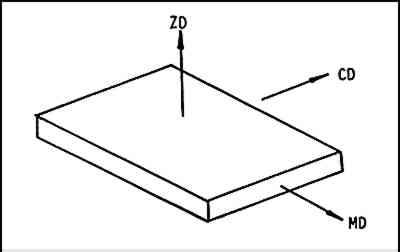
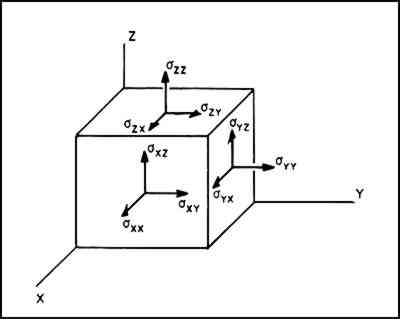
Figure 1 is an outline of the many furnish and formation variables which contribute to the composite structure of paper. The following discussion of only one of the formation variables, paper direction, should demonstrate the complexity of paper as a composite structure. The main factors controlling paper direction are fiber orientation (how the fibers are lying in the sheet), bonding, and drying conditions. There are three directions defined: the machine direction or MD, the cross machine direction or CD, and the out-of-plane or ZD direction. Paper is an anisotropic material: it has different properties depending on the direction of the sheet tested. There are nine elastic modulus measurements that can be made along the three different axes.5, 6, 7 Most measurements are made in the MD or CD
Sheet direction is largely dependent on the direction in which individual fibers are deposited on the screen during manufacture. The fibers lying lengthwise, parallel to the machine direction, contribute the properties associated with that direction (such as strength, response to moisture, and deformation). Individual fiber properties (see Figure 4) are partly responsible for this characteristic. Fibers are composed of the primary wall, and the S1, S2, and S3 secondary walls. The secondary walls contain fibrils.
The S2 layer is the dominant layer in the cell wall.8 The fibril angle of the S2 layer influences the individual fiber's physical properties and therefore sheet properties, such as direction. The fibril angle is the degree that the fibril is either perpendicular to or parallel to the fiber. Fibrils aligned with the fiber are said to have a “low” angle and fibrils not aligned are said to have a “high” angle. Papers composed of fibers with “low fibril angle” withstand greater load and less elongation than those with “high” angles. Fibril angle varies within the same fiber source depending on the variables previously mentioned, such as early or late wood, source of the fiber, etc.9 Drying conditions also influence sheet direction. When two fibers cross in a sheet, each influences shrinkage of the other. Waterhouse discusses the manner in which restraint while drying can change fiber properties. Microcompressions and crimps influence the strength properties of the paper. For example, in a conservation test intended to measure the effects on paper of different water sources, the restraint could be altered, therefore affecting the test data regarding strength properties. The data may show a change that is not related to the sources of water being tested, but instead to change in restraint between the unwetted control and the wetted specimens. This is one of many factors that make the comparison difficult of “before” and “after” treatments, or of two different papers and their response to testing. Bonding also contributes significantly to differences in sheet direction and the anisotropic properties of the sheet. However, bonding in paper is an area currently being researched and many interactions are not fully understood at this time. Network theories attempt to describe the physical properties of a paper sheet in terms of individual fiber properties such as those previously mentioned: fibril angle, paper direction, bonding, and others. Peterson discusses the history of network theories and the attempts to correlate various theories with observed data. As theories are developed to explain the complexities of paper structure, more accurate models are proposed. However, the influence of the properties of individual fibers on the overall structure of paper remains elusive. Peterson discusses thirteen theories ending with the contributions of Van den Akker. After reviewing the various theories, Peterson concludes:
Attempts to test, measure, or predict paper properties based on individual components, whether chemical or physical, have not been as successful as testing the physical properties of paper as a composite structure. The preceeding discussion of only one variable, paper direction, has shown the complexity of paper as a structure, and the contribution of many variables and their interactions to testing and the interpretation of data. 3 PAPER AS A VISCOELASTIC MATERIALPAPER'S VISCOELASTIC NATURE can cause variability in test data. Interpretation of test data requires an understanding of elasticity, viscoelasticity, stress-strain (elastic modulus), and moisture and temperature relationships. A review of elasticity prior to discussing viscoelastic properties is useful. Elasticity in solids is a function Modulus of elasticity is a conversion of Hooke's Law to make it dimension-independent by referring the force to unit area and unit length. “Stress” is the internal force per unit area which resists the external load. “Strain” is the ratio of the change in dimensions to the original dimension. The coefficient of proportionality (slope of the line when stress is plotted against strain) is the modulus of elasticity. Modulus of elasticity is a quantitative statement of the ability of a material to react to deformation, which is dependent on the order of crystallinity of the material.
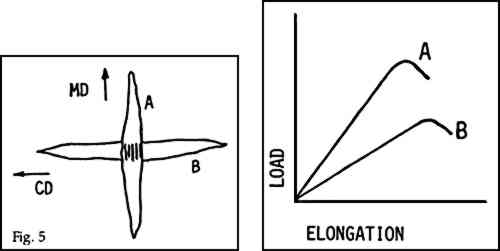
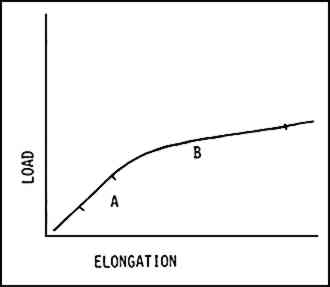
As a viscoelastic material, paper has both crystalline and amorphous areas and it exhibits elasticity and plasticity of flow. A comparison of elastic and viscoelastic responses to an exterior force (load) is shown in Figure 6.
The area marked “A” shows the elastic region where there is a linear relationship between load and elongation. Deformation in this region is elastic and recoverable depending on the amount of the load, and the length of time the load is maintained. The area marked “B” shows the viscoelastic region. Here, the response to deformation is not linear, the response is very time dependent, and there is only partial recovery to the original dimensions once the load has been removed. A viscoelastic material is malleable in that it can respond and adjust to a force or load “because of the continuing rearrangement of molecular segments.”12 Crystalline and amorphous regions influence this rearrangement and limit the return to original dimensions. Paper exhibits the following viscoelastic properties:
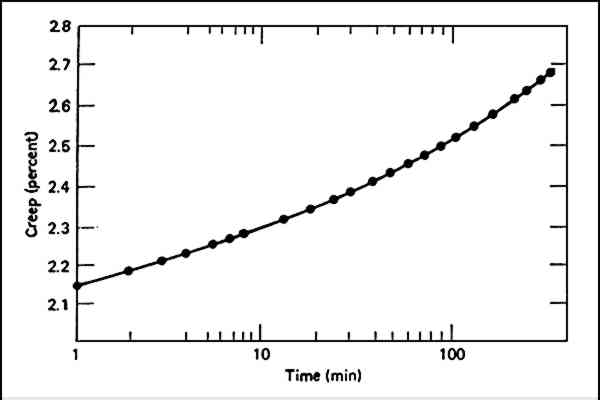
Creep and stress-relaxation are two conditions which result from nonrecoverable deformation in paper due to its viscoelastic nature. Figure 7 shows a graph of creep in paper. If a load is applied to a sample and the deformation measured, the straight line in the graph begins to curve. If the load is removed, the paper will only partially recover its former shape, and will be permanently deformed. “The paper starts out as a purely elastic body and then, after a 1 to 2 percent strain, begins to exhibit flow. If the load is held constant, the paper will flow indefinitely until it breaks.”14 Creep occurs, for example, with printing papers and wallpapers, where force has been applied to the paper and then released.
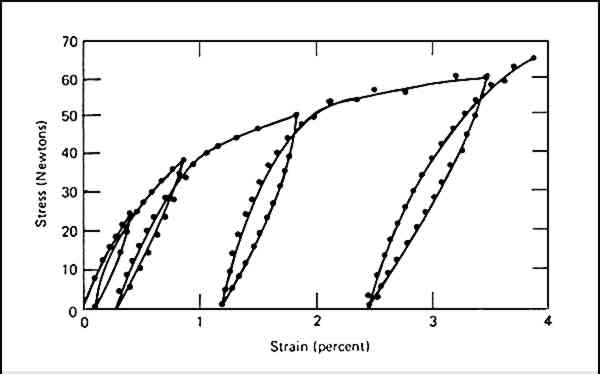
Stress-relaxation curves (Figure 8) are obtained by placing a load on a sample and then removing it, taking a measurement, and applying the load again. As the cycle of loading and deloading is repeated, an individual “profile” for that particular sheet is obtained.
All papers have creep and stress-relaxation characteristics, however, the curves obtained for each are different for every paper tested. This is another reason why it is difficult to compare two different papers, or the same sheet with part used as a “control” and the other part used as a treatment specimen. 4 MOISTURE-TEMPERATURE RELATIONSHIPSCROOK AND BENNETT comprehensively studied the effects of humidity and temperature on the physical properties of paper. They investigated the effects on eleven different properties of fourteen different papers. Their conclusions are based on 100,000 individual test results. In the summary of their investigation they state:
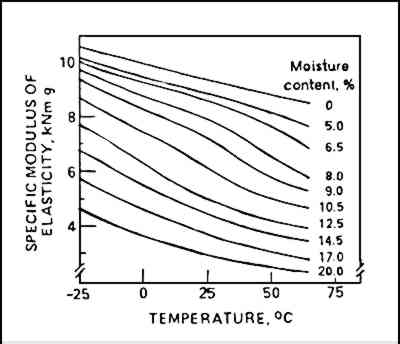
The degree of elastic or viscoelastic properties in a paper depends largely on environmental conditions of moisture and temperature. There is a well defined transition zone between elastic (“glass-like”) and viscoelastic behavior. It is defined by the glass-transition temperature or “Tg.” Below the Tg temperature, dry cellulose will behave as an elastic material, and above its Tg, it will exhibit viscoelastic behavior. For dry cellulose, these temperatures are: cellulose 240�C, hemicellulose 190�C, and lignin 150�C.16 Moisture absorption causes a lowering of the Tg of cellulose. This results in plasticization of cellulose because elastic properties are converted to viscoelastic (plastic or flow) properties. Consequently, mechanical and other physical properties are greatly affected. Elasticity is significantly affected by temperature. Change in elastic modulus as a function of temperature and moisture content for one paper is shown in Figure 9.
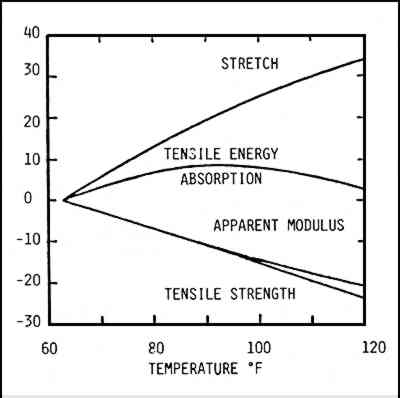
Temperature changes also alter other physical properties. Crook and Bennett demonstrated a 5% change in test values for fold, tensile, stretch, burst, and dynamic tensile with a temperature change from 60�F to 75�F and constant relative humidity.18Figure 10 shows the results of four physical tests taken in both machine and cross directions. Measurements were made at 63�, 91�, and 120�F. Changes in physical properties were 25%, 35%, and 20% respectively. A 6% change was noted for a change of temperature from 69.5� to 76.5�F. Due to the importance of temperature on testing paper properties, Wink recommended temperature control be tightened to (23�C � 2�C).19
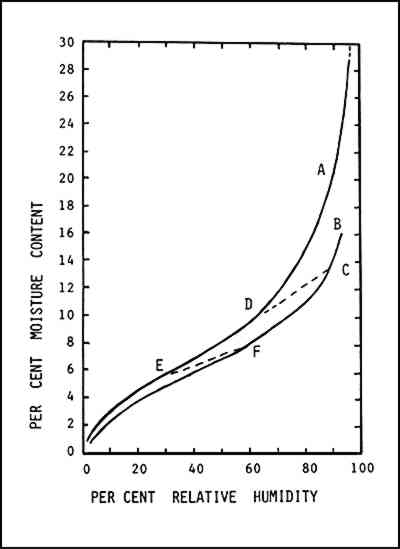
When reviewing research data, the paper-temperature relationship should be considered when evaluating the magnitude and possible sources of changes in data values. 5 PAPER-MOISTURE RELATIONSHIPSTHE RATE AND AMOUNT of moisture regain is dependent on time and the chemical source of the cellulose. The more crystalline the paper, the lower the capacity for absorption. Moisture uptake is greater in papers with higher hemicellulose or lignin content. It is also greater in papers altered by chemical treatments which reduce crystallinity,20 such as oxidative bleaching. Moisture content depends not only on chemical constituents and physical properties, but also on the manner in which the paper was brought into equilibrium. There is a different moisture content at any given relative humidity depending on whether the moisture was desorbed (brought into equilibrium from a higher relative humidity) or adsorbed (brought into equilibrium from a lower relative humidity). The curves for desorption and adsorption are not the same. This is known as the hysteresis effect, and is shown in Figure 11.21
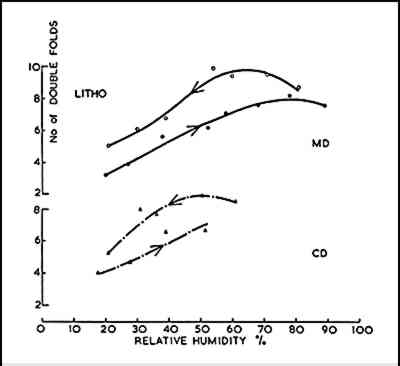
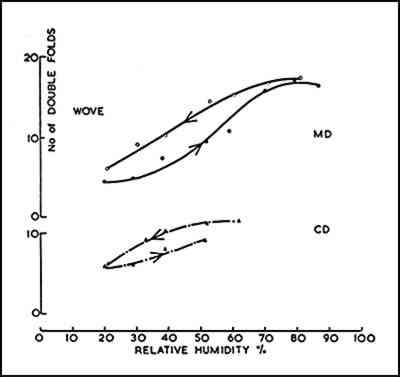
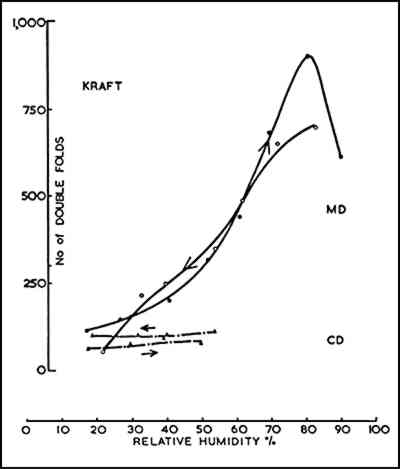
Figures 12, 13, and 14 show hysteresis curves for samples of three types of paper that were properly preconditioned. Each of these figures demonstrates that the data obtained is different at any relative humidity depending on whether the measurement was made after desorption or adsorption. Conservation studies that compare before and after aqueous treatments of any type (humidification, steaming, bathing) are analogous to this situation. Interpretation of test results must account for the magnitude of change in results due to hysteresis effects. Crook and Bennett demonstrated the effect of hysteresis on fourteen papers through numerous tests. They state:
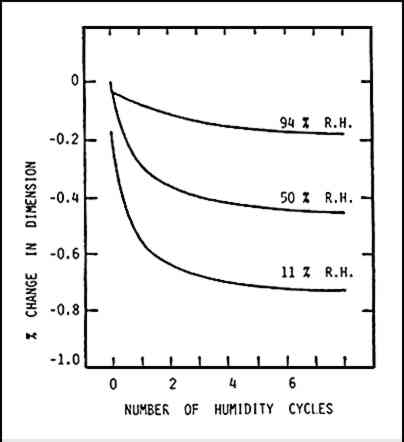
Prior history of moisture gain and loss also affects moisture regain capacity and paper properties. Since paper is a viscoelastic material, it does not return to the same dimensions after drying and rewetting, or after humidity cycling. There is a progressive change in dimension after each humidity cycle, with the greatest change occurring after the initial cycle.23(Figure 15)
Wink studied dimensional changes in linen writing paper during changing relative humidity conditions. He exposed samples to the humidity cycle of 50%, 11%, 50%, 94%, 11% in increments of about 15% R.H. He repeated the cycle eight times, with the temperature at 73�F. Wink found appreciable shrinkage at the three relative humidity levels. The curves show that the stress-relaxation effect dominates the swelling effect to such a degree that all dimensions at 94% relative humidity were smaller than the initial dimensions at 50% relative humidity.24
Moisture is so critical to the properties of paper that the TAPPI standard for temperatures and moisture require a temperature of 23� � 1�C and a relative humidity of 50% � 2%.26 The TAPPI standard acknowledges the discrepancy caused by the hysteresis effect in moisture content and recommends preconditioning the sample from below 50%, by absorption. This same standard emphasizes the effect of preconditioning and the hysteresis effect in the section, “Importance of Preconditioning”:
Crook and Bennett emphasize the importance of the hysteresis effect when they conclude: Researchers often use handsheets prepared in the laboratory under controlled temperature and relative humidity conditions. The use of handsheets eliminates effects caused by the unknown history of humidity cycling, hysteresis, moisture content, creep, and stress-relaxation. The use of papers other than handsheets (for instance historical papers) presents unknown variables making correct interpretation of data complex or impossible. 6 INTERPRETATION OF TEST DATATHE PREVIOUS DISCUSSIONS are intended to show the composite structure of paper, the many variables affecting the testing of that structure, the sensitivity of the variables to their prior history and testing conditions, and the possible effects of Valid paper conservation research must be based on the relationship of the inquiry to the research design. The sample material, sample population size, conditioning of the samples, testing methodology, and appropriate instrumentation for testing must be carefully chosen. The data must be analyzed and interpreted with appropriate consideration given to possible ambiguity caused by the samples' manufacturing techniques and history, and the testing methodology. Test results that demonstrate either an increase or decrease in strength properties, as measured by fold endurance for example, could be interpreted in several ways: An increase in strength, as measured by fold endurance, does not necessarily mean improvement in paper properties. For example, an increase in strength measurement could be attributed to cross-linking caused by an increased production of aldehyde groups. Test results do not provide answers, they show changes. Researchers should address other possible interpretations of data and provide an explanation for their interpretation either through theory or additional supporting tests. For example, cross-linking may be identified by changes in wet tensile as a percent of dry tensile test results, or by changes in the degree of polymerization. Understanding the choice of instrumentation used in a project is important to overall evaluation of the results. Each test method is useful for obtaining a particular type of information. For example, fold endurance testing has been used because of its ability to detect changes earlier than other physical methods. This information can be useful in conjunction with data from other physical methods, or as a general indication of trends useful in designing a research project. However, by itself, fold endurance is not a reliable research tool.30 As early as 1939, the Institute of Paper Chemistry made a comparison of three fold endurance instruments and concluded that in all cases the percent deviation was very high.31 Casey discusses the wide variation in individual test results which “has caused some people to consider the fold endurance test useless.”32 He discusses the number of tests needed to obtain significant data and the magnitude of differences in data necessary for significant data and the magnitude of differences in data necessary for significant results: The sample population of many research projects reported in the conservation literature is often as low as ten, and differences in data less than 20%. The interpretation of these projects should be questioned. In 1956 Hoffman found that there is a greater deviation in high fold than in low fold values.34 In 1964 and 1966 Kahlson and Lindholm investigated the cause of wide test variation in fold endurance data. They determined that motor warm up and mechanical frictional heat caused a local rise in temperature at the point of fold. The resulting drop in local relative humidity at the sample test site greatly reduced fold endurance. They discovered that using a fan to maintain constant air circulation around the specimen could reduce variability.35 Current TAPPI standards require a fan as part of the instrumental control. Even with a fan, variability is still high. TAPPI standards state that the degree of precision for “repeatability” (same lab, same instrument, same operator, same sample) is 20% and for “reproducibility” (different lab, different operator, same instrument, same sample) is 30% at the 95% probability level for the MIT instrument. The standard further states:
Fold endurance tests are very sensitive to moisture. In their summary of all tests of physical properties, Crook and Bennett state in reference to fold endurance:
Controversy exists over the type and amount of loading during the fold test and the magnitude of discrepancy caused by the weight. The MIT tester allows for variable weights, the Schopper is set for one load setting. Luner discusses the problem of using a standard load on sheets of various basis weights and tensile strength.38 Cardwell et al. also discusses the effect of equally loading differing papers during aging tests.39 Casey states that using the same 1 kg. weight on all samples “is unfair to papers of low tensile strength; it is not a true test of flexibility is such cases.”40 Kohler recommends not using a standard load, but one that is a percentage of the initial tensile strength of the paper.41 Crane comments on the use of standard loads on samples before and after aging tests: In many paper conservation research projects, the same weights are used on the control samples as on the tested samples. The use of the same weights may produce unreliable test results. Fold endurance results are influenced by formation and furnish variables. Different values are obtained depending on how the paper was manufactured. Fold endurance rises in the early stages of beating, but drops with further beating and wet pressing.43 It increases with basis weight up to a point, but decreases with higher weights.44 Crane found that fiber orientation, as a result of fiber composition and drying tension, influences fold values.45 He also reported that the presence of fines affects the relationship of fiber length to fold endurance.46 Given this information, it is questionable that two different papers can be compared accurately using this test. In the conclusion of his study of fold endurance testing, Crane comments:
The following general statements can be made regarding the interpretations of data and evaluation of research based on fold endurance values:
The same type of investigation that has been used in the discussion on fold endurance tests can be applied to other instruments and research designs in order to better evaluate paper research projects and interpret the data. 7 CONCLUSIONPAPER RESEARCH IS difficult to conduct, interpret, and judge due to the composite structure of paper and the variability due to each sheet's prior history. Each sheet of paper is unique in its physical and chemical properties and its response to testing those properties. There are many ways of obtaining information in conservation, from single observations to shared information among colleagues, and from mock-ups stuck in windows to full research projects. All of these approaches are valid and can give significant information within the the context of their specific limits. Much of our information is of necessity based on limited observations, and always will be because of the nature of conservation and the many unknowns that can never be repeated or simulated for a major research endeavor. However, many of our current treatment practices such as water bathing, enzyme use, deacidification, and bleaching are based upon published research which requires careful review. The topics discussed in this paper should assist in critically reviewing results of paper research projects and the provided interpretations. It is important that research projects related to paper conservation have the involvement of people with expertise in material sciences research. This background is necessary for proper research design, choice of test methods and instrumentation, and for insightful interpretation of data. ACKNOWLEDGEMENTSI AM GRATEFUL to the National Museum Act for funding my attendance at the following courses at the Institute of Paper Chemistry, Appleton, Wisconsin: Pulp and Paper Physics, Dr. Baum; Pulp and Fiber Analysis, Dr. Litvay; Pulp and Paper Testing, Dr. Waterhouse. Dr. William Wilson, National Archives, has tirelessly edited this paper and taught me a great deal about paper as a material and paper testing. John Krill, Winterthur Museum, has been both encouraging and supportative contributing thoughtful direction and comments. Dr. Jonathan Arney, Mead Paper Research Division, has patiently edited, commented, and supported my efforts through many drafts. REFERENCESR.E.Prud'homme, A.Robertson, “Composite Theories Applied to Oriented Paper Sheets,” TAPPI, vol. 59, (January 1976), pp. 145–148. W.Brostow, Science of Materials, New York, John Wiley and Sons, (1979) p. 262. J.Litvay, “Paper and Fiber Analysis,” Institute of Paper Chemistry, course material, July 1983. Ibid. R.W.Mann, G.A.Baum, C.C.Habeger, “Determination of All Nine Orthotropic Elastic Constants for Machine Made Paper,” TAPPI, vol. 63, (February 1980). G.A.Baum, D.C.Brennan, C.C.Habeger, “Orthotropic Elastic Constants of Paper,” TAPPI, vol. 64, (August 1981). E.H.Fleischman, G.A.Baum, C.C.Habeger, “A Study of the Elastic and Dielectric Anisotropy of Paper,” TAPPI, vol. 65, (October 1982). J.Litvay, “Paper and Fiber Analysis,” Institute of Paper Chemistry, course material, July 1983. Ibid. J.F.Waterhouse, “Paper Structures and Directionality,” Seminar on paper properties and their measurement, Institute of Paper Chemistry, 1982. W.S.Peterson, “Network Theories,” Seminar on paper properties and their measurement, Institute of Paper Chemistry, 1982. D.Rosenthal and R.Asimov, Introduction to Properties of Materials (New York: Van Nostrand, 1971), pp. 81 ff. J.P.Casey, editor. Paper Testing and Converting, vol. IV of Pulp and Paper (New York, (Interscience Publishers, Third edition, 1981), p. 1779. Ibid. p. 1780. D.M.Crook and W.E.Bennett, The Effect of Humidity and Temperature on the Physical Properties of Paper (The British Paper and Board Industry Research Association, 1965). (Emphasis added) J.F.Waterhouse, “Testing Conditions for Paper Evaluation,” Seminar on paper properties and their measurement, Institute of Paper Chemistry, 1982. N.L.Salmen and E.L.Back, “Moisture-Dependent Thermal Softening of Paper, Evaluated by its Elastic Modulus,” TAPPI, vol. 63, (June 1980), 117–120. Crook and Bennett, p. 2.2. W.A.Wink, “The Effects of Relative Humidity and Temperature on Paper Properties,” TAPPI, vol. 44 (June 1961) 177. Waterhouse, Seminar on paper properties and their measurement. Wink, p. 172. Crook and Bennett, p. 1.9. Wink, p. 176. Ibid. Ibid. (Emphasis added) TAPPI Standard T-402 or 70. Ibid., Appendix 1, “Importance of Preconditioning.” (Emphasis added) Crook and Bennett, p. 1.7.
Wilson, W., personal communication, May 1983. Ibid. T.Crane, “The Folding Endurance of Paper,” Seminar on paper properties and their measurement, Institute of Paper Chemistry, 1982. Casey, Pulp and Paper, p. 1806. Ibid., p. 1807. (Emphasis added) Ibid., p. 1806. Crane, “The Folding Endurance of Paper,” p. 3. TAPPI standard 511 su 69. (Emphasis added) Crook and Bennett, pp. 1.7–1.8. (Emphasis added) P.Luner, “Paper Permanence,”, TAPPI, vol. 52 (May 1969), p. 801. R.Cardwell, L.Lyon, and P.Luner, “Evaluation of a Fold Endurance Procedure for Paper Aging Studies,” TAPPI, vol. 55 (February 1972), p. 229. Casey, Pulp and Paper, p. 1804. Ibid. Crane, “Folding Endurance,” p. 10. Casey, Pulp and Paper, p. 1339. Ibid., p. 1805. Crane, “Folding Endurance,” p. 5. Ibid. Ibid., p. 6
 Section Index Section Index |