DETERMINATION OF THE SPECIFIC RATE CONSTANT FOR THE LOSS OF A YELLOW INTERMEDIATE DURING THE FADING OF ALIZARIN LAKERobert L. Feller, Ruth M. Johnston-Feller, & Catherine Bailie
ABSTRACT—In the course of photochemically-induced fading, alizarin lake mixed with a photochemically-inert titanium white in a poly(vinylacetate) vehicle apparently passes through a yellow intermediate stage. A simple graphical method is described which permitted calculation of the specific rate constant for the first-order rate of fading of the yellow intermediate. 1 INTRODUCTIONTHE TEXTILE AND PAINT INDUSTRY today is able to carry out extensive color-matching computations which, through measurement and analysis of the spectral reflectance data of pigment mixtures, can be used to predict the types and ratios of pigments that will yield the particular color under consideration.1 Some years ago, the thought occurred to us to follow the fading of opaque paints based on a fugitive colorant in mixture with a photochemically-inert high-scattering white pigment by computing, at each point in time, the concentration of colorants necessary to match the faded condition.2 Thus, through the use of modern “color-matching” computations, the change in concentration of the fugitive colorant with time can be determined and from thence, an analysis of the rate of fading can be accomplished from the point of view of chemical kinetics. The results of a study of the rate of fading of alizarin lake (C. I. Pigment Red 83, No. 58000; Ciba-Geigy X686) in mixture with titanium white (C. I. Pigment White 21; DuPont Ti-Pure� R-960) in a poly(vinylacetate) vehicle during exposure in an Atlas Electric Devices (Chicago, Ill.) xenon-arc Fade-ometer� have been reported earlier in this journal.2 Microscopic examination of cross-sections of the test paints revealed that in this paint system applied at complete hiding, fading took place on the upper surface of the coating in a zone which varied in depth from about 4 to 20 micrometers, depending upon the pigment volume concentration (PVC) and the concentration of the principal light-absorbing pigment. We have previously reported similar depths of the faded zone in other paint systems.3 2 FIRST-ORDER RATE EQUATIONSANALYSIS OF THE DECLINE in the computed concentration of alizarin lake during exposure of these opaque mixtures of alizarin lake and titanium white revealed that, within the narrow zone in which fading took place, a constant fraction of the alizarin lake tended to be lost during any given period of exposure. The loss of a fixed fraction of the material present at any point in time corresponds to rate behavior known as first-order kinetics. This is expressed mathematically as
In the integrated form this becomes
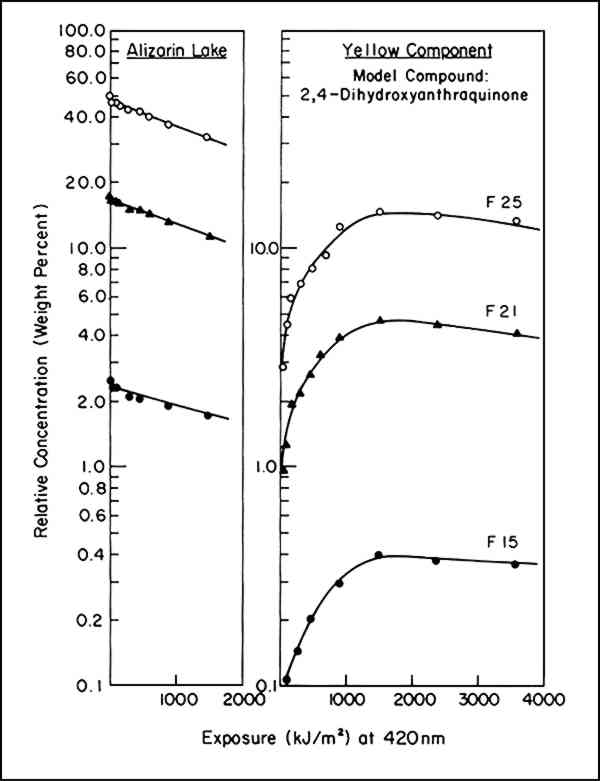
Because the intensity of illumination diminishes with the age of the xenon lamps, instead of time we used the product of intensity times time, or exposure, for t. Thus, instead of reporting the fraction of alizarin lake lost per hour, the rate, in a sense, is expressed in terms of the fraction lost per footcandle hour or, in our case, per kiloJoule/cm2. The irradiance was monitored at a wavelength of 420 nm. As reported,2 the specific rate constant, k1, was found to be essentially constant throughout a range of initial concentrations of alizarin lake pigment of from 50 to 2.5% relative to the titanium white and a range of pigment volume concentration (PVC) of titanium white from 19 to 2.5%. This is indicated by the identical slopes of the plots of log A (equivalent to lnA/2.303) vs. exposure in Figure 1 regardless of initial concentration.
3 FORMATION OF A YELLOW INTERMEDIATEUPON CALCULATION OF THE CONCENTRATION of pigments necessary to match the spectrophotometric curves of the faded states of the test panels of alizarin lake and titanium white formulated in poly(vinylacetate), applied at complete hiding, the color-matching computations indicated that the addition of a yellow component was usually required. Figure 1 shows a typical result: along with the expected decrease in the amount of alizarin lake with increased exposure, there was also at first a rising, then a declining, concentration of a yellow component present in many of the exposed panels. Such behavior can be expected as the result of a sequence of chemical steps that may be represented by the equation
In our initial report,2 we demonstrated that the apparent rate of disappearance of the alizarin lake tended to follow equation ii. We further reported that the fading of alizarin and its yellow intermediate appeared to follow a sequence of events such as shown in equation iii and cited a specific first-order rate constant, k2, for the disappearance of the yellow. However, the method used to obtain the rate constant for this second step was not explained. We wish now to describe the technique used to obtain values of k2 by a simple graphical procedure. 4 EQUATIONS FOR THE RATE OF FORMATION AND LOSS OF THE INTERMEDIATEIN VIEW OFEQUATION iii, the concentration of intermediate Y at any time, t, can be accounted for by the following equation:
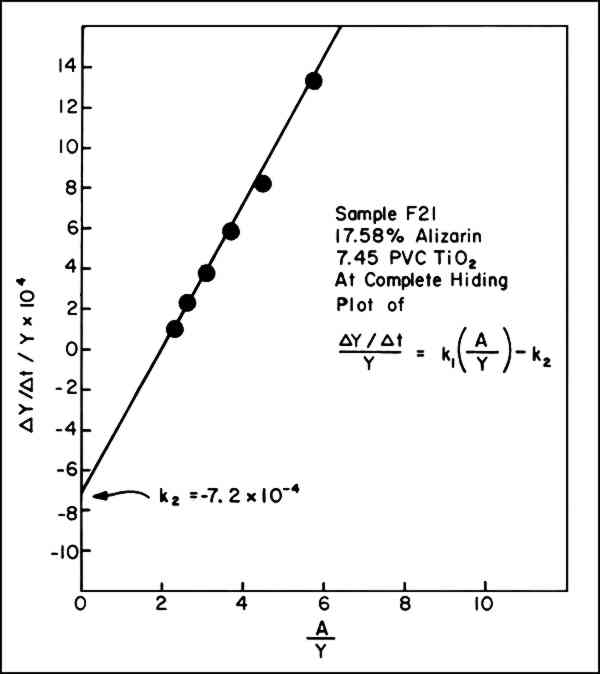
We chose to obtain k2 by rearranging vi further to conform to the general equation for a straight line, y = b + mx, where m is the slope and b is the intercept on the y ordinate. Thus:
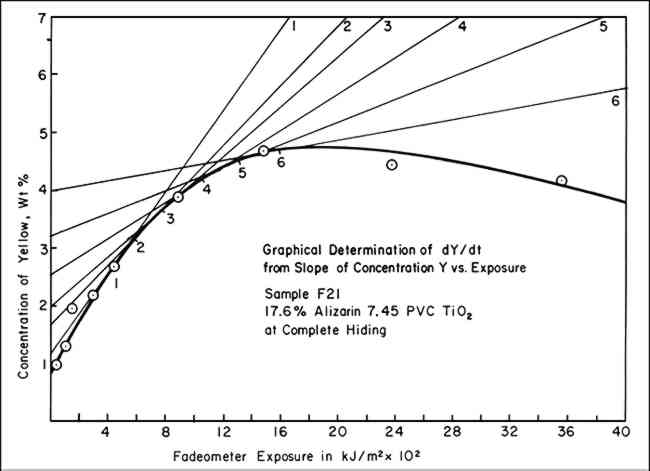
5 GRAPHICAL SOLUTIONS TO EQUATIONSIN ORDER TO UTILIZEequation vii, values of (dY/dt)/Y must be obtained. A graphical method can be used to provide this information. To accomplish this, the concentrations of the yellow component in the exposed panels, which the color-matching computations showed was required to match the faded state, were plotted on linear graph paper versus the exposure (t), expressed in terms of kiloJoules per square meter, kJ/m2, monitored at 420 nm. These data resulted in a series of points through which a smooth curve could be drawn showing the rise and subsequent fall in concentration of the yellow component, illustrated by the heavy-lined curve of Figure 3. By inspection, lines are drawn tangent to the curve at various points of tangency. The slope of these lines is dY/dt, the change in the concentration of Y per unit of
An example of the data necessary for preparing a graph such as that in Figure 3 is presented in Table I. Typical data, which we usually employed only for the calculated concentrations of yellow before it had reached its maximum concentration (at which point, incidently, the slope is zero), are shown in Figure 2. According to equation vi, the intercept on the ordinate axis of the line connecting these points is the value for k2 and should be negative. While the example here is for a sample made at complete hiding, the same procedure for obtaining k2 has been successfully applied to the data for samples at incomplete hiding. Table I Sample F21 Example of Data Used to Calculate k2 from Curve of Percent Yellow Versus Exposure 6 VALUE OF K2 INDEPENDENT OF TRUE CONCENTRATION OF YELLOW COMPONENTTHE PRECISE CONCENTRATION of component Y was unknown since we do not know the chemical nature of the yellow intermediate compound and, hence, we could not know the precise spectral reflectance data to employ in the color-matching computations. Arbitrarily, the spectral reflectance curve or the yellow (unlaked) form of alizarin, 2,4-dihydroxyanthraquinone, was selected for our initial calculations, but we do not wish to imply that this is indeed the intermediate, Y. As the results in Table II indicate, however, the use of any one of three different yellow colorants in the color-matching program, even though each had slightly different spectral reflectance characteristics, had little effect on the values of k2. Consideration of equation vii will show why this is so: the intercept, k2 [that is, (dY/dt)/Y, when A/Y = 0] is not sensitive to uncertainties in Y. This is because any correction factor necessary to yield the true value of Y will appear in both the denominator (dY/dt) and numerator (Y). Thus, the effect on the intercept, k2 of a systematic factor of error in Y tends to cancel out. Table II Specific Rate Constant for Fading of Yellow-Form, k2, Using the Spectral Reflectance Characteristics of Three Different Yellow Pigments in the Color-Matching Calculations When Computing the Concentration of the Yellow Component Vehicle: Vinac� B-7; Paint at Complete Hiding 7 CONCLUSIONTABLE IIISUMMARIZES the values of k1 previously reported (obtained from equation ii) and of k2 obtained from the graphical solution of equation vii. For the particular batch and dispersion of alizarin lake/titanium white paints used in this investigation, the specific rate of disappearance of the yellow intermediate indeed seems to be a constant, suggesting that the fading of the yellow intermediate also proceeds according to first-order kinetics. Table III Specific Rate Constants k1 and k2 for Fading of Alizarin Lake in Mixture With Titanium White in Xenon-Arc Fade-ometer� (Pyrex/Pyrex Filters) Vehicle: Poly(vinylacetate) Vinac� B-7; Complete Hiding These initial interpretations concerning the apparent rate of fading of alizarin lake confirm the potential usefulness of modern color-matching computations in facilitating the analysis of the phenomenon of fading in paints according to well-known principles of chemical kinetics. REFERENCESSee, for example, R. G.Kuehni, Computer Colorant Formulation, Lexington: Lexington Books, D. C. Heath and Company, 1975. R.Johnston-Feller, R. L.Feller, C. W.Bailie and M.Curran, “The Kinetics of Fading: Opaque Paint Films Pigmented with Alizarin Lake and Titanium Dioxide,” J. American Institute for Conservation, 23 (1984): 114–129. Since this date a more extensive treatment of the subject has been published: R. M. Johnston-Feller, “Reflections on the Phenomenon of Fading,” J. Coatings Technology, 58, No. 736 (1986): 32–50. R. L.Feller, “Studies on Photochemical Deterioration,” Report to the ICOM Committee on Conservation, 4th Triennial Meeting, Venice, 1975, Paper 75/19/4. In our first presentation of these concepts (Reference 2), we used the symbol C (for concentration) to describe the first-order rate equations, but the different set of symbols A, Y, and C seem particularly appropriate here to represent the concentration of the three chemical components expressed in equation iii. The authors also consider that the minus sign is an essential part of the specific rate constant, although this is not the usual convention found in textbooks of physical chemistry. Nonetheless, equations ii and v are the form in which the equations are usually found.
 Section Index Section Index |