THE KINETICS OF FADING: OPAQUE PAINT FILMS PIGMENTED WITH ALIZARIN LAKE AND TITANIUM DIOXIDERuth Johnston-Feller, Robert L. Feller, Catherine W. Bailie, & Mary Curran
ABSTRACT—The physical-chemical principles that govern the fading of pigments have been difficult to discover solely by visual observation of changes in color. The authors' use of precise spectrophotometric reflectance measurements and modern color-matching computations based on the Kubelka-Munk theory have made it possible to demonstrate that the decrease in concentration of alizarin lake (fading) during exposure in a Fade-ometer� follows first-order kinetics. The traditional artists' colorant, alizarin lake, was used as a model of a fugitive organic pigment in mixture with a scattering white pigment, titanium dioxide, applied in a poly(vinyl acetate)-based paint at complete hiding. The experimental results indicate that the red-colored alizarin lake tends to be converted to a yellow form which in turn fades to a colorless condition, also by first-order kinetics. The specific rate of fading is shown to be essentially constant over a wide range of initial concentrations of colorant and of pigment volume concentration. 1 INTRODUCTIONTHE FADING OF THE PIGMENTS used in paints is ubiquitous. It is only a matter of time; the more fugitive the pigments used, the shorter the time. Some of the pigments used by the old masters were extremely fugitive—some very stable. What remains for current generations to enjoy is the result of differential rates of fading; what future generations will see of modern paintings will also be the result of the differential rates of fading of the pigments each artist has used in his time. As a paint fades, the eye perceives a complex change in one or more of the psychological dimensions of color: hue, lightness, and saturation. These subjectively-sensed changes are related to decreases in the concentrations of the colored components in a highly complex way—our eyes are not physical measuring instruments. Hence, using visual comparisons alone, investigators have not been able to express the degree of fading quantitatively in terms of the changes in the concentration of the colored materials. Pigments are based on chemical compounds and should, therefore, obey stoichiometric and kinetic laws of chemical reactions in the course of their deterioration induced by photochemical and thermal activity. Owing to the physical complexity of the components in paint films, however, the chemical mechanism for the fading of pigments in paint films has not generally been considered amenable to analysis according to the principles of chemical kinetics. Today, computer color-matching techniques are widely used by manufacturers of colored materials, such as paints, plastics, and textiles, to calculate colorant formulations—the mixture of pigments necessary to make a desired color. We consider that these same techniques can also be used to determine a colorant formulation necessary to match faded materials in terms of the amounts of original pigments remaining following exposure. Thus, in the investigations to be described, color-matching techniques were used to determine the concentrations of pigments present at any given stage in fading. 2 BACKGROUNDTHESE INVESTIGATIONS were first undertaken in 1962, and we have been further convinced, since that time, that many organic colorants in paint systems tend to fade according to first-order kinetics. In 1976, with the availability of modern computational techniques for colorant formulation, we designed a fifth series of experiments to study the kinetics of the fading of the widely used artists' pigment, alizarin lake, incorporating in this study many of the variables in the formulation of paint films. A few of the principal experimental results will be reported here for the case of opaque paint films made with a mixture of alizarin lake and titanium dioxide white pigment. Principally, we shall demonstrate that the process of fading of these opaque films can be described on the basis of first-order kinetics for the loss of alizarin lake as a function of exposure time. The statement that the fading of a colorant system takes place according to “first-order kinetic behavior” means that the rate at which pigment is lost at any given moment is a constant fraction of the quantity of pigment present at that point in time. In other words, the rate of disappearance of the colored compound is proportional to its concentration. This is expressed mathematically as1:
Equation i may be expressed in the integrated form:
A review of the literature revealed only a few articles describing studies of the fading of pigmented or dyed materials in terms of chemical kinetics. In 1954, Haug suggested that paints often faded according to the first-order kinetic law, but his experimental data were not convincing and his work has rarely been cited.2 Baxter, Giles, and coworkers in the late 1950's, investigating films of molecularly-dispersed dyes in gelatin, methyl ethyl cellulose, and collodion, and measuring the changes in the concentration in terms of the logarithm of the absorbance of the dyes in the transparent films, showed that the rate of fading frequently followed first-order behavior.3,4 Several years later, Kortum used the Kubelka-Munk K/S function (Equation iv) to follow the thermally-induced fading of photo-darkened dyes absorbed on various substrates.5 Subsequently, the Kubelka-Munk function (Equation iv) was used to demonstrate that light-induced fading of dyes in pharmaceutical tablets followed the first-order law.6 In the results to be described, the relative amount of alizarin lake remaining in the light-exposed paint panels was computed by means of the Kubelka-Munk equations for opaque pigment mixtures7:
In order to solve Equations iii and iv, it is necessary to use the internal reflectance as R∞; this refers to the reflectance that would occur if there were no surface reflectance as a result of the refractive index differences between the paint medium and air. This is computed from the following equation8:
The K's and S's in Equation iii are the original absorption (K) and scattering (S) constants determined on the unexposed samples.7 From these characterized values, the concentrations (the C's) of the coloring matter in any mixture can be computed, using Equation iii and the measured reflectances of the exposed samples converted to K/S by Equation iv. The equation applies to a single wavelength of light only; hence, the reflectances at many wavelengths across the spectrum are necessary for the evaluation of the C's, solved simultaneously to fit the measured spectral data. In a previous paper dealing with alizarin glazes (transparent or translucent films containing only alizarin-lake pigment), it was shown that use of the Kubelka-Munk equations appropriate to the case of films at incomplete hiding would permit prediction of the color changes occurring during the fading of glazes.10 The results to be reported here are those obtained, with alizarin lake mixed with a scattering white pigment, rutile titanium dioxide (TiO2), for the case of films made at complete hiding, that is, at a thickness so great that no light penetrates through the paint film to the substrate. The effect of a number of characteristic variables in paint formulation were investigated for both glazes and opaque films, but details of our findings with other variables must await subsequent publication. It was our belief at the inception of this research that if the spectrophotometric curves of the original and of the faded states of a paint could be analyzed by colormatching computational techniques, it would then be possible to determine, for each faded state, the concentration of the original colored material that remained in a faded zone near the surface of the paints. In addition, if a new colorant of different hue were generated, the relative amount of the new colored substance could also be calculated. Thus, in order to obtain the concentrations of the colored components present at any given time during the course of the exposure of an alizarin lake-titanium white paint, we simply used a color-matching program to determine the percentage composition of pigments needed to “match” the color of the paint at each stage in the course of fading. 3 EXPERIMENTAL3.1 Pigments and VehicleThe vehicle used for these studies was a solvent-dry system based on a moderate molecular weight poly (vinyl acetate), Vinac� B-7 (Air Products Chemicals, Allentown, Pa.), a polymer of excellent photochemical stability similar to those sometimes used by conservators as a vehicle for retouching. The pigments used were alizarin lake (Ciba-Geigy X-686) and rutile titanium dioxide (du Pont Ti-Pure� R-960). The latter exhibits low photochemical activity.11 3.2 Preparation of the PanelsSeparate dispersions of the alizarin lake and of the titanium dioxide were made by ball-milling in a toluene solution of the poly(vinyl acetate) vehicle. These dispersions were then blended together to achieve the desired pigment and vehicle composition. The pigment ratios, alizarin lake/TiO2 on a weight basis, and the pigment volume concentrations (PVC) used in this study are described in Table I. Table I Compositions of Test Paints in Poly(vinyl acetate) The paints were applied to Eastman Kodak glass slides, 3�″ � 4″, by draw-down, using bars with a clearance of not greater than three mils. The draw-downs were made in a jig containing nine slides, of which only the center slide, uniform in appearance, was used. The glass was always weighed before coating so that the film thickness could be calculated from the weight and density of the solids in the paint. The purposes of applying the paint to glass slides were (a) to determine the completeness of hiding by measuring the reflectance over a white and over a black substrate and (b) to achieve a surface as smooth and free of irregularities as possible. The freshly coated panels were allowed to dry at ambient conditions for about an hour and were then baked overnight at 130�C to remove solvent. When necessary to achieve complete 3.3 MeasurementsSpectrophotometric curves of the paint panels initially and at intervals during exposure were measured using the integrating-sphere mode on a “Trilac” recording spectrophotometer (Leres, Alfortville, France) equipped with a small digital computer for 0% and 100% line corrections of the measured data at 10 nm intervals. Simultaneously, as the reflectance curves were being measured, computations at 10 nm intervals were performed to yield the CIE tristimulus values for Illuminant C, the chromaticity coordinates, and color differences all based on corrected reflectances. The CIE 1976 L∗a∗b∗ color-difference equation was used.12 Measurements were made with the specular (gloss) reflectance included (designated SCI or total reflectance, RT) and excluded (designated SCE) to determine changes in specular reflectance. Measurements were also made over a white and over a black substrate to make sure that the paint had remained at complete hiding throughout the exposure. Pressed barium sulfate was used as the white reference standard. 3.4 Exposure TechniqueThe panels were exposed in an Atlas Electric Devices (Chicago, Ill.) Model 65-WRC xenon-arc Fade-ometer� equipped with Pyrex�-glass filters which effectively eliminated radiation below 310 nm, closely simulating the range of spectral energy that passes through window glass. The air temperature in the chamber averaged 30.5� to 35�C; the black-panel temperature between 59� and 60�C. The ambient air in the chamber measured 20% R.H., with little deviation. Each time the panels were returned after measurement their position on the rotating rack in the Fade-ometer� was randomized with respect to the upper and lower positions. The painted glass panels were backed with a glass slide covered half with a stack of six white Millipore� filters (Millipore Corp., Bedford, Mass.) and half with black matte paint applied on aluminum foil. A pressed-wood support was arranged to leave an air space of ⅛″ between the samples and the black and white background. The purpose in mounting the samples over the black and white panels was to determine if there were any differences in the results owing to heating of the panels even though hiding in the visible spectral range was complete; none was found for these opaque samples. Because the intensity of the polychromatic irradiance in the Fade-ometer� declines with the age of the xenon-arc lamps, the rate calculations are expressed in terms of “exposure” rather than time—that is, the product of light intensity times clock hours. The Fade-ometer� is equipped with a light-monitoring device that measures the intensity of radiation on the samples at a selected wavelength, in this case 420 nm. Exposure, therefore, is expressed in kilojoules/meter2 (kJ/m2) as measured at 420 nm. During these experiments, 14.8 kJ/m2 was equivalent to about one hour of exposure. In the course of only a few hundred hours time, the distribution of the spectral power was not expected to change significantly. The fact that the rate constant determined in a second series of experiments at a later date (Figure 5) was identical within experimental error supports this expectation.
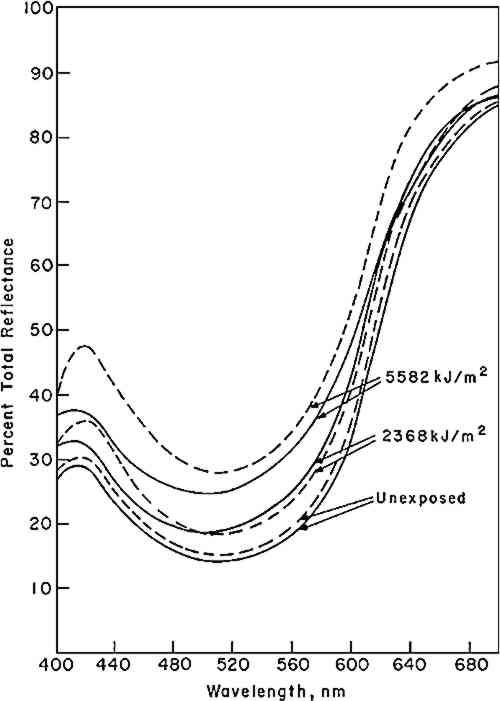
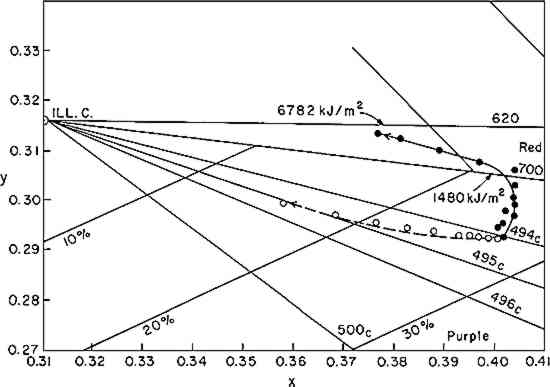
4 RESULTS4.1 KineticsOne of the first effects noted in our original study conducted in 1962–3—observed initially with alizarin added to a commercial flat alkyd-base paint and subsequently in a series of panels made with the acrylic emulsion, Rhoplex� AC-33 (Rohm and Haas Company, Philadelphia, Pa.)—was that the alizarin lake did not fade directly to a colorless form. Instead, a yellow intermediate was formed which, in turn, apparently faded to a colorless state. This behavior has been observed in all of our studies on the exposure of alizarin lake in mixture with a white pigment when the paint film was opaque (at complete hiding). Figure 1 illustrates some of the spectral curves
Kineticists frequently describe behavior such as this in terms of a series of consecutive chemical reactions as indicated by Equation vi,
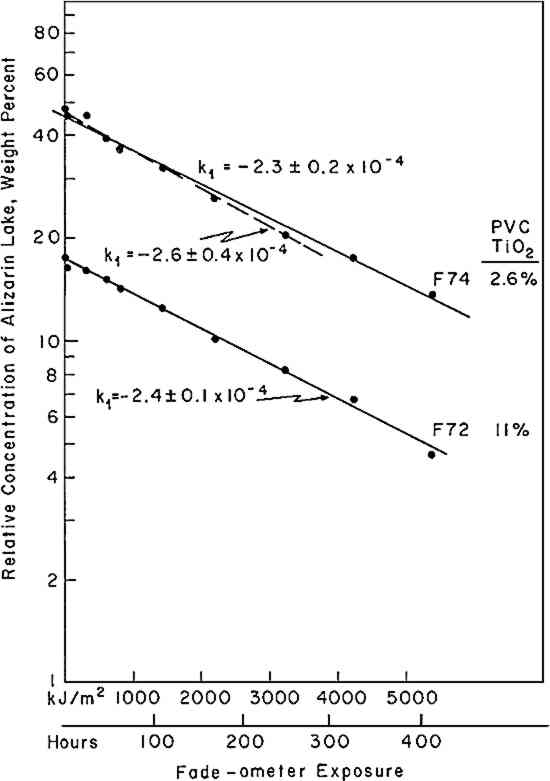
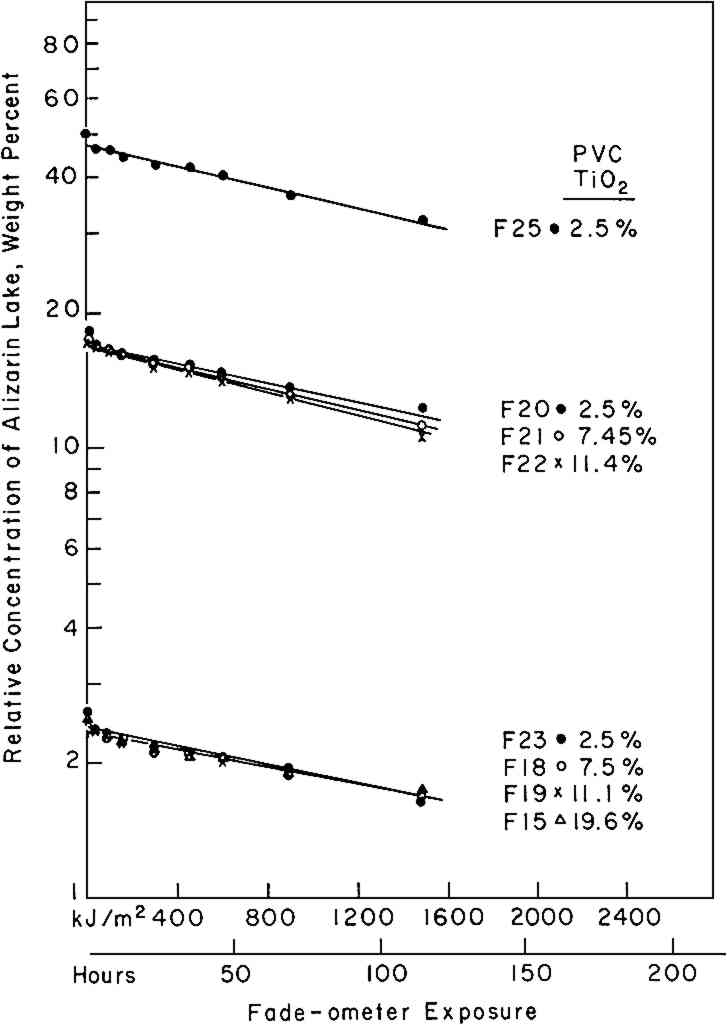
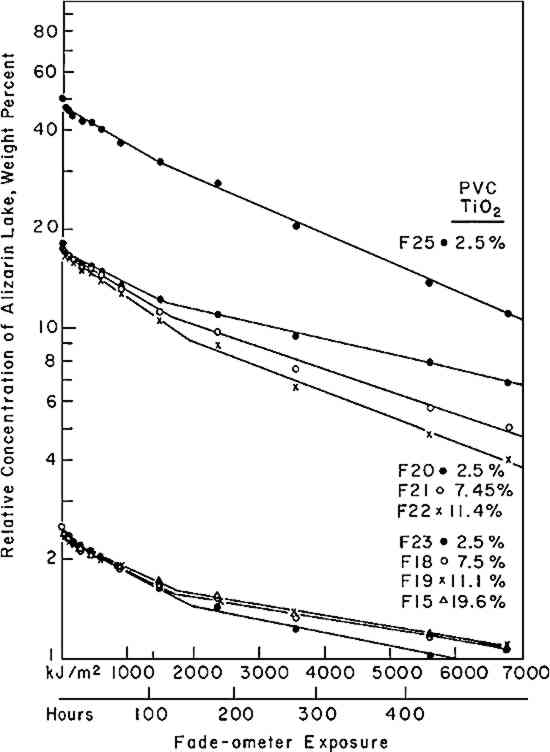
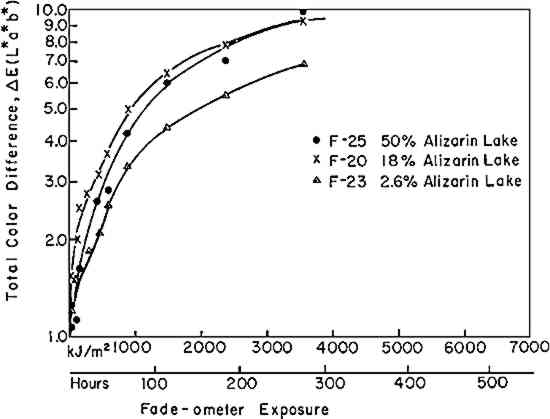
If the rate of fading of a colorant (alizarin lake in this case) follows a first-order rate law (Equation i), the experimenter may verify this by plotting the experimental data according to the integrated form of the equation (iia or iib); a graph of the logarithm of the concentration of the colorant versus the exposure will yield a straight line, the slope representing the specific rate constant, k1. Figure 3 shows the relative concentration of alizarin lake measured at various intervals of exposure, placed on a logarithmic scale, versus the exposure up to 1500 kJ/m2; the specific rate constants (the slopes) together with the 95% confidence interval, calculated from Equation iia by means of the least-squares solution, are given in Table II. Two facts become clear: first, regardless of the relative initial concentration of alizarin lake and regardless of the pigment volume concentration in the paints, the relationship is linear; second, within experimental error, the specific rate, k1, is constant over the considerable range of concentrations and PVC's employed. During the 1500 kJ/m2 period of exposure about one-third of the alizarin colorant had faded. In this length of time a control sample of the ISO R105 blue-wool fading standard No. 4, placed in the Fade-ometer� along with the alizarin panels, had faded to the extent of Geometric Grey Scale Contrast 3.13 Table II First Order Rate Constant for Fading of Alizarin, k1, in Vinac� B-7 at Complete Hiding The exposure of this set of panels was continued for almost 7000 kj/m2. The extended data are shown in Figure 4. The curves appear to have two first-order stages: that up to 1500 kJ/m2 and a slower stage after this period. In addition, an abrupt change took place initially in the first few hours of exposure. These two characteristics have been observed by previous authors.4,5,14,15 The break at 1500 kJ/m2 may be due to the more rapid fading of the smaller pigment particles, a fact long observed in the paint Further investigation will be necessary before a fully confident explanation of the apparent break in the curves can be provided. In many samples of this same paint system that we have prepared since these initial investigations, we have found no such sharp break. Figure 5 illustrates this behavior in a set of samples prepared several years The experimental results show that the specific rate of fading of the alizarin lake is, within experimental error and over a loss of between 30 and 70% of the initial concentration of lake, essentially independent of the relative concentration of alizarin lake, and of the pigment volume concentration (PVC). Thus, the pale tints did not lose The specific reaction rate for the fading of the yellow form, the k2 in Equation vi, was also determined for all samples; however, description of the complex mathematical technique used for calculating k2 will not be included here. The important conclusions are that k2 was found also to relate to a first-order reaction and that k2 was always larger than k1—that is, the specific rate of fading of the yellow intermediate is faster than the specific rate of concentration change of the red alizarin lake. 4.2 Visual Color ChangesMunsell notations were calculated for all the exposed samples in order that the color changes might be visualized by reference to the Munsell Book of Color. The Munsell data for one of the samples, mid-way in terms of relative alizarin lake-titanium dioxide concentration and pigment volume concentration, are presented in Table III. Table III Summary of Total Reflectance Measurements and Calculated Munsell Notations on Exposed Sample F-21 Color differences as the panels progressively faded from the original color were also calculated using the CIE 1976 L∗ a∗ b∗ equation. This equation expresses the total color difference, ΔE, as the square root of the sum of the squares for the lightness-darkness difference, ΔL∗, the redness-greenness difference, Δa∗, and the yellowness-blueness difference, Δb∗.12 One unit of ΔE (L∗a∗b∗) represents a good commercial color match; one-half unit of ΔE (L∗a∗b∗) is, on the average, a minimum perceptible difference. The calculated values of ΔL∗, Δa∗, and Δb∗ approximate the direction of the color shift and the ΔE represents the total color difference that the eye perceives. Figure 6 shows the total color difference, ΔE, plotted against the exposure for three samples, all at 2.5% PVC titanium dioxide, which contained 2.5%, 18%, and 50% alizarin lake by weight relative to the total dry pigment concentration. One would not be able to recognize first-order fading behavior from such data. Moreover, the midconcentration range, 18%, exhibited the highest color change, ΔE, up to about 3000 kJ/m2 exposure; the lowest net color change occurred in the case of the palest tint, 2.5% alizarin. These data additionally demonstrate the fact that for every pigment there is a range of relative pigment-white concentration for which the visual differences in color will be highest for a particular percentage loss in the concentration of colorant. Experience and theory reveals that the concentration of colorant which will exhibit the maximum ΔE (visual change) is one that will yield a reflectance of about 40% at the wavelength of absorption maximum.
5 DISCUSSIONTHE FORMATION OF a yellow intermediate compound found in these studies contrasts with the results obtained previously with glazes (alizarin lake, without titanium dioxide, applied at incomplete hiding).10 In that investigation we found that the color of the dark samples also made an abrupt shift towards yellow during fading. In the case of the dark glazes, however, the shift towards the yellow was calculable on the basis of the changes taking place in the spectrophotometric curve shape as the concentration of alizarin diminished; no yellow compound was ever needed to match the color of the faded glazes. Included in our investigations were a number of samples of alizarin lake mixed with titanium dioxide at incomplete hiding, not reported in the paper on glazes nor in this In the publication on the glazes, we described a simplified version of the Kubelka-Munk equation for incomplete hiding, a “single-constant” equation, useful but not as accurate as the two-constant equation in which both K and S are variables. The scattering coefficient, S, was assumed to be constant, and only the absorption coefficient, K, was assumed to vary during the exposure. We can also describe a simplified equation applicable to a relatively transparent pigment, such as alizarin lake, in mixture with a highly scattering white pigment in a paint film applied at complete hiding. Again the assumption is made that the scattering of the paint film is constant. As in the case of the glazes, we may then assume that the only change in color is caused by a change in the absorption coefficient, K. On this basis we can calculate a color match to the faded samples using a simplified “single-constant” equation applicable to the case of complete hiding:
If a pigment fades directly to a colorless form—that is, if no intermediate compound is formed which absorbs light of the same wavelength as that absorbed at the absorption maximum of the pigment being tested—a further simplification can be made. If both assumptions mentioned are true—S does not change, and K at the absorption maximum is not affected by the formation of another species absorbing at this wavelength—then we can apply kinetic analysis by using the (K/S) value (Equation iv) at the wavelength of maximum absorption as the measure of concentration of the absorbing pigment remaining. Thus, to analyze the kinetics of the fading process, the log (K/S) at the absorption maximum can be plotted against time or net exposure. In two of the publications cited5,6 the authors used this abbreviated method to demonstrate the first-order behavior of the colorants. 6 CONCLUSIONPRECISE SPECTROPHOTOMETRIC reflectance measurements, made before and during the exposure of paint films to radiant energy, coupled with computer color-matching calculations based on the Kubelka-Munk equations, can be used to compute the percentages of pigment remaining after exposures for various lengths of time. With such quantitative data regarding the concentration of colorants at any particular time in the course of fading, the principles of chemical kinetic analysis may be applied. Using the artists' pigment, alizarin lake, as a model chromatic pigment in mixture with rutile titanium dioxide white, we have shown that the fading of alizarin lake, in an opaque, high-gloss paint film made with poly(vinyl acetate) as the vehicle, approximates Spectrophotometric curve analysis also revealed that the red alizarin lake pigment tends to fade to a yellow intermediate before fading to a colorless form. By means of Munsell Notation and CIE color-difference calculations, curves were developed to show how the orderly change in concentration relates in a non-linear fashion to the perceived color of the paint. The inadequacy of visual evaluations for quantifying the changes in pigment concentrations is thus illustrated. The techniques described are equally applicable to the study of the fading of other pigments, alone or in mixture. REFERENCESSee, for example, Moore, J. W. and Pearson, R. G., “Kinetics and Mechanism”, John Wiley and Sons, NY, 1981. Haug, R., “�ber den Zusammenhang der Lichtechtheit organischer Farbk�rper mit ihrer Konzentration in Mischungen mit Substraten”, Farbe und Lacke, 1954, 340–344; “Untersuchungen �ber die Lichtechtheit organischer Pigmente,” Deutsche Farben Zeitung, 15 (1961) 373–378. Baxter, G., Giles, C. H., McKee, M. N. and Macaulay, N., “The Influence of the Physical State of Dyes Upon their Light Fastness,” J. Soc. Dyers & Colourists, 71 (1955), 218–235. Baxter, G., Giles, C. H. and Lewington, W. J., “Relation Between Physical State and Rate of Fading of Dyes,” J. Soc. Dyers & Colourists, 73 (1957), 386–392. Kortum, G., Kortum-Seilev, M. and Bailey, S. D., “Optical Properties of 2-(2′–4′-Dinitrobenzyl)-Pyridine in the Absorbed State,” J. Physical Chem., 66 (1962), 2439–2442. Everhard, M. E. and Goodhart, F. W., “Stability of Certified Dyes in Tablets I. Fading of FD&C Red No. 3 in Tablets as a Function of Concentration, Time and Light Intensity,” J. Pharm. Sci., 52 (1963), 281–283. See, for example, Kuehni, R. G., “Computer Colorant Formulation”, Lexington Books, D. C. Heath and Company, Lexington, MA, 1975. Judd, D. B. and Wysecki, G., “Color in Business, Science and Industry,” 3rd Edition, John Wiley and Sons, NY, 1975, p. 417. Brockes, A., “The Influence of Glossy Surfaces on Reflectance Measurements,” Die Farbe, 9 (13) (1960), 53. Johnston-Feller, R. and Bailie, C., “Analysis of the Optics of Paint Glazes: Fading”, in N. S.Brommelle and G.Thomson, Science and Technology in the Service of Conservation, International Institute for Conservation of Historic and Artistic Works, London, 1982, pp. 180–185. “Ti-Pure� Titanium Dioxide for Coatings”, Technical Brochure E-42003, duPont Chemicals and Pigments Department, Wilmington, Del., 1981. Billmeyer, F. W., Jr. and Saltzman, M., “Principles of Color Technology, Second Edition”, John Wiley and Sons, NY, 1981, p. 63.
Feller, R. L. and Johnston-Feller, R. M., “Use of the International Standards Organization's Blue-Wool Standards for Exposure to Light. I. Use as an Integrating Light Monitor for Illumination Under Museum Conditions”, Preprints of papers presented at the sixth annual meeting, The American Institute for Conservation of Historic and Artistic Works, Fort Worth, Texas, 1–4 June, 1978. Giles, C. H., Johari, D. P. and Shah, C. D., “Some Observations on the Kinetics of Dye Fading”, Textile Research J., 38 (1968), 1048–1056. Lachman, L., Swartz, C. J., Urbanyi, T. and Cooper, J., “Color Stability of Tablet Formulations II; Influence of Light Intensity on the Fading of Several Water-Soluble Dyes”, J. Am. Pharmaceutical Assoc., 49 (1960), 165–169. Hafner, O., “Lightfastness of Organic Pigments as a Function of their Particle Size Distribution”, J. Paint Technology, 47 (1975), 64–69.
 Section Index Section Index |