THE CLEANING OF DAGUERREOTYPES: COMPARISON OF CLEANING METHODSM. Susan Barger, S.V. Krishnaswamy, & R. Messier
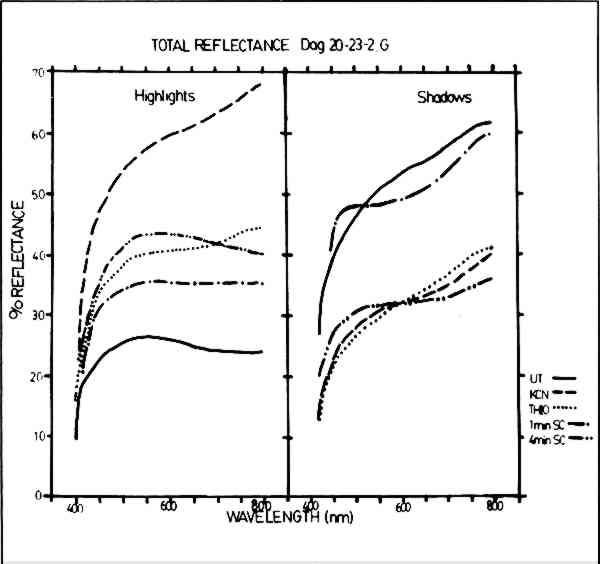
3 RESULTSTHE GRAPHS in Fig. 1 show the results of total reflectance (diffuse plus specular reflectance) measurements made using the reflectance spectrophotometer for the untreated and cleaned samples. The overall reflectance of the untreated highlight (Step 1) area (Fig. 1a) is a rather flat curve of low overall reflectance which is indicative of a white, diffusely reflecting surface.14 The one-minute sputter cleaned sample produced a similarly shaped curve of somewhat higher reflectance, indicating a loss in diffusivity without a substantial change in color appearance. Both the thiourea sample and the four-minute sputter cleaned sample show similar gains in specularity indicating a comparative loss in the number of image particles. However, the difference in curve shapes indicates changes in the color cast appearance of the samples such that the thiourea sample may appear “warmer” due to an increase in reflectance in the longer wavelengths of the spectrum and the sputter cleaned sample may appear “cooler” due to the increase in a reflectance in the shorter wavelengths. The sample cleaned with KCN shows a dramatic increase in specularity and alteration of color tone.
The reflectance curves shown in Fig. 1b show the results for the shadow region (Step S) of the test samples. The untreated sample has a high overall reflectance with a slightly yellowish cast. The one-minute sputter cleaned sample has somewhat less overall reflectance with a more pronounced warm color cast. The curves for the thiourea sample, the KCN sample, and the four-minute sputter cleaned sample show a similar reduction in specularity and a general flattening of the curves suggesting a white, uniformly diffuse reflecting appearance more like what would be expected in a highlight region. CESEMI was used to monitor changes in image particle size, image particle spacing, image particle distribution and the total number of particles. Due to the fact that mercury was used as a particle tag, CESEMI could only make accurate counts on Steps 4 through Shadow (Step S); for as the image particles become smaller in size and greater in number in the highlight areas, less mercury is present.15 As a result, image particles typical of highlight areas (here, Steps 1–3) cannot be easily distinguished from the underlying silver of the daguerreotype plate by this chemical analysis technique, even though they can be clearly seen in the SEM micrographs. CESEMI data from Step 4 (midtone) and Step 7 (grey shadow) will be considered in detail because the features of these steps are representative of the cleaning effects on all steps. Microstructural alteration typical of the effects for each of the cleaners are clearly shown in the secondary electron micrographs found in Figs. 6–8. The CESEMI data are not inconsistent with these micrographs; however, the micrographs give a more graphic indication of cleaning effects than is possible with CESEMI.
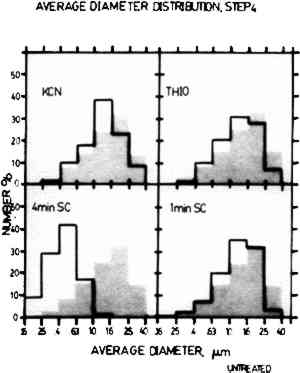
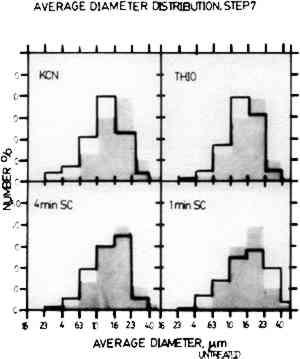
The histograms in Figs. 2 and 3 show the comparison of the average diameter distribution for the untreated sample of Step 4 and Step 7 (shown in grey) with the corresponding sample for each cleaning procedure. The average diameter distribution indicates changes in average particle size for all treatments. It should be noted that the average particle sizes are plotted on a log scale and thus small changes may appear more drastic due to histogram groupings. Further, the results are normalized and do not account for changes in the number of particles.
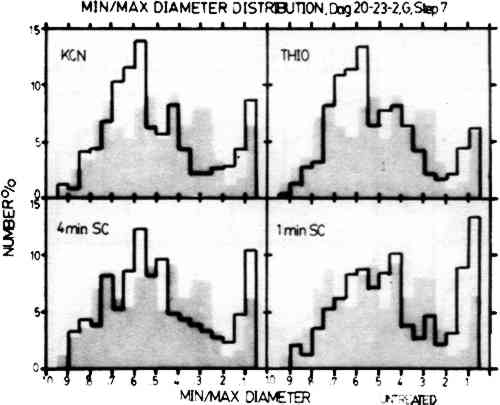
In Step 4, the particle size preservation is very good for both the one-minute sputter cleaned sample and the thiourea sample, but the treatment with KCN causes a large reduction in particle size. The results for the four-minute sputter cleaned sample show that sputter cleaning can also cause a drastic alteration in particle size if the sputtering conditions are too harsh. For Step 7, both of the sputter cleaned samples showed fairly good particle size retention. However, the results for the KCN sample The histograms shown in Fig. 4 indicate changes in particle shape plotted as the ratio of the minimum diameter to the maximum diameter of the image particles. In these histograms, round particles have a diameter ratio of 1.0 and oblong particles have a diameter ratio approaching 0. Step 7 is shown here because the untreated sample has the full range of image particle shapes found in daguerreotypes. The one-minute sputter cleaned daguerreotype shows a similar range of particle shapes with no particular shape dominant over any other. The four-minute sputter cleaned sample also shows fairly good particle shape retention, but not as good as the one-minute sputter cleaned sample. The thiourea sample and the KCN sample show a pronounced alteration in particle shapes with a rounding trend seen as the increase in the percentage of particles in the 0.7 to 0.5 min/max diameter ratio range.
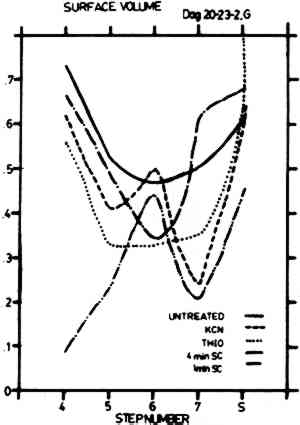
Figure 5 shows the percent volume (∑ first chords/total test length, roughly equivalent to the amount of surface covered by image particles) for Step 4 through Shadow for all cleaning treatments. It is evident that the untreated sample and the thiourea sample have similar curve shapes indicating that the thiourea may reduce particle number in a way that still allows for the overall retention of the characteristic daguerreotype appearance, even though the cleaned image will appear faded. The one-minute sputter cleaned sample shows better retention of particle number with a somewhat altered curve shape. This may result in a somewhat altered appearance due to changes in the particle geometry. Both the KCN sample and the four-minute sputter
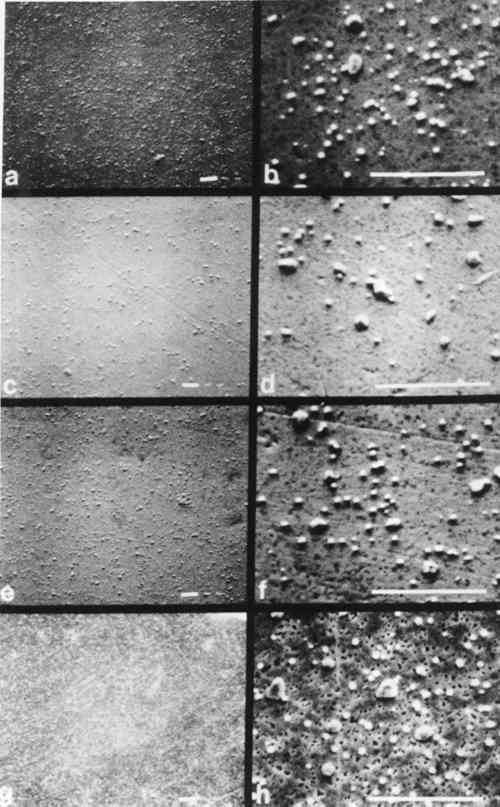
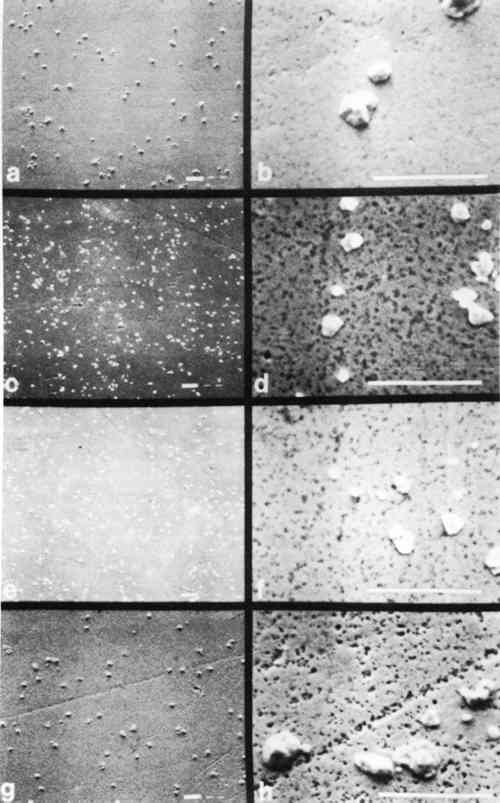
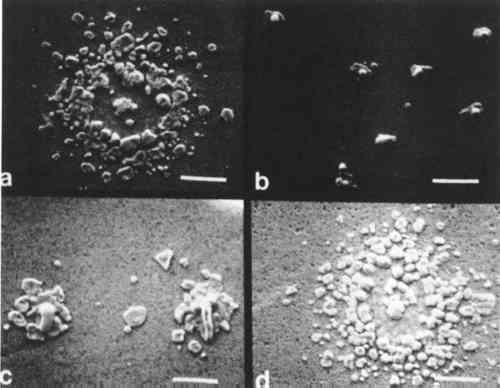
The series of micrographs in Figs. 6 and 7 show characteristic microstructural alteration due to cleaning for Step 4 and Step 7, respectively. The results for the untreated sample, the KCN sample, the thiourea sample, and the one-minute sputter cleaned sample are shown at two different magnifications. This allows for the comparison of the general features of alteration of the gross microstructure, as well as the individual image particles. There is also included a similar series of micrographs (Fig. 8) of shadow-particle agglomerates showing the effect of the cleaning procedures. These micrographs show clearly the changes in image particle geometry and distribution that are brought about by cleaning. The extreme alteration of particle shape and the increase in the number of particles that results from cleaning in KCN is especially apparent in Figs. 7c, 7d and 8b. To a lesser extent, thiourea causes similar alterations as shown in Figs. 7e, 7f and 8b. Figure 7 gives an indication of the nonselectivity of solvent cleaners, which, in this instance, causes a decrease in the number of image |