THE CLEANING OF DAGUERREOTYPES: COMPARISON OF CLEANING METHODSM. Susan Barger, S.V. Krishnaswamy, & R. Messier
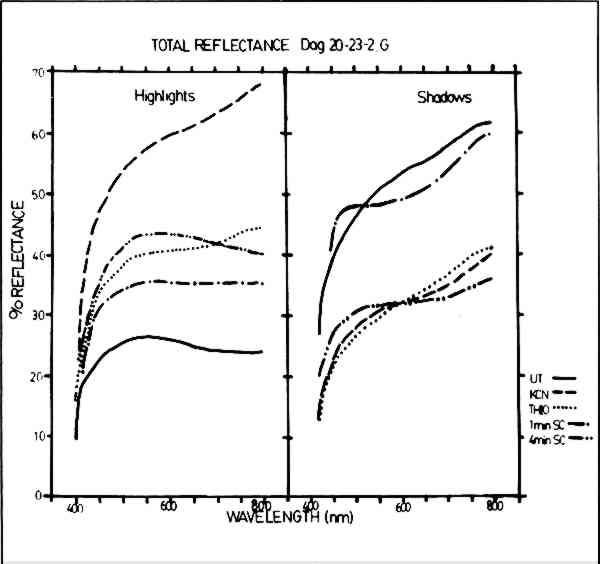
ABSTRACT—In order to compare and quantify the effects of various cleaning methods for daguerreotypes, two daguerreotypes were made using 19th century methods on daguerreotype plates manufactured in this laboratory. These daguerreotypes were imaged with a seven-step step tablet so that relatively large areas of like exposure and apparent density could be compared. One daguerreotype was gilded; the other was left ungilded. Each daguerreotype was cut into five pieces, and one piece of each was treated in a potassium cyanide solution; one, in a thiourea-phosphoric acid solution; two, by physical sputter cleaning, a new technique; and the fifth piece was left untreated to be used as a standard for comparison. The effects of the various cleaners were determined by comparing changes in the image particle size and distribution, and the average particle number per given area, against the standard. This comparison was done using Computer Evaluated Scanning Electron Microscope Images (CESEMI), a computer interfaced scanning electron microscope system that allows for the recognition and counting of particles of specified chemistry using an energy dispersive x-ray analysis system. 1 INTRODUCTIONSINCE THE DAGUERREIAN ERA, the usual method for the removal of tarnish from daguerreotypes has been the use of various solutions of solvent cleaners. Until the mid 1950's, the most widely used cleaning solution was potassium cyanide; after that time, solutions of thiourea acidified with phosphoric acid have been the cleaners of choice. These solvent cleaners alter the appearance of daguerreotypes not only by the removal of silver sulfide tarnish, but also by the removal of other constituents of the daguerreotype: silver, mercury, gold, and copper. The chemical action of these cleaners is not fully understood, and in some cases their use has caused irreversible damage to daguerreotypes.1 The work of Swan2–4 and Rempel5 provides introduction and review of the history of daguerreotype cleaning, the deterioration of daguerreotypes, and the current recommendations for the care of tarnished and otherwise damaged daguerreotypes. The ideal daguerreotype cleaner, as set forth in an earlier paper6 should selectively remove sulfur from the silver sulfide (Ag2S) tarnish and other tarnish debris, but otherwise leave the underlying daguerreian microstructure unaltered. Since the Ag2S layer is, in general, much thinner than image particle height, removal of the complete Ag2S layer would also be an acceptable solution to the cleaning problem. This paper describes experimental results from a comparison of the effects of traditional daguerreotype cleaning methods using solvent cleaners, and also a new method, physical sputter cleaning. Both the effects on gross appearance (optical properties) and the effects on the microstructure are examined in order to determine the efficacy of these cleaners. Sputter cleaning refers to a cleaning process carried on in a gas plasma. This cleaning process may entail only the physical removal of material, as in physical sputtering, or the removal of a volatile species formed by chemical reactions in the sputtering gas(es), as in chemical sputtering. Physical sputtering is like a billiard game played on an atomic level in which material is removed due to the momentum transfer from the impact of heavy ions from an inert gas plasma (e.g., Ar+). There are two types of chemical sputtering: plasma chemical reduction and reactive sputtering. The use of plasma chemical reduction on daguerreotypes has been described in a recent paper by Daniels.7 In that instance, an H2 plasma was used to reduce Ag2S on the daguerreotype surface by apparently forming H2S which was pumped away by the vacuum system [Ag2S (s) + H2 (g) → 2Ag (s) + H2S (g)].8 Plasma chemical reduction does not cause any appreciable removal of material from the daguerreotype since the H+ bombarding ions are very light and thus transfer little momentum to the Ag2S layer. Other reactive gases (e.g., O2, used in this study) can be substituted for H2. These gases (or gas combinations) are chosen to produce selective chemical reactions on the sample surface and can be tailored to remove unwanted materials while leaving the desired materials intact. Again, a volatile species can be formed and carried away by the vacuum system [e.g., Ag2S (s) + O2 (g) → 2Ag (s) + SO2 (g)].8 In addition, the heavier O2+ bombarding ion can cause a significant physical sputtering. Inert gas sputtering is purely a physical removal process. Sputtering in hydrogen is essentially a chemical reduction process, and reactive gas sputtering is a combination of both physical and chemical processes. 2 EXPERIMENTAL METHODSTWO MODERN daguerreotype step tablets were used to compare the effects of cleaners for tarnish removal on daguerreotypes. These daguerreotypes were made using 19th century methods9 on daguerreotype plates manufactured in this laboratory, and the daguerreotypes were imaged with a seven-step step tablet which allowed relatively large areas of like exposure and apparent density to be compared.10 One daguerreotype was gilded, one was left ungilded. Because gilded daguerreotypes are more representative of 19th century daguerreotypes,11 the following discussion concentrates on the results obtained from the gilded daguerreotype. It should be noted that these daguerreotypes were several years old, but not appreciably tarnished. The daguerreotypes were cut into five strips. For each daguerreotype, one strip was left untreated as a standard for comparison. One strip was placed in a 1% solution of potassium cyanide (KCN) for five minutes,12 one strip was placed in a “standard” solution of thiourea daguerreotype cleaning solution of 70 grams thiourea and 80 cc phosphoric acid per liter of solution for five minutes,4 and one was sputter cleaned in an O2 and Ar sputtering gas mixture for four minutes. The reactive rf sputtering conditions were: rf voltage (300 V); rf power (50 Watts); and a gas mixture of 10 mTorr Ar and 1 mTorr O2. The fifth strip was sputter cleaned for one minute using the same sputtering parameters as above. In order to examine the gross effects of cleaning on the overall appearance of daguerreotypes, particularly with regard to “fading,” the total reflectance of both highlight and shadow regions of all samples was measured using a Beckman DK2a Ratio Recording Spectrophotometer (BaSO4 coated integrating sphere, BaSO4 standard, and PbS detector) with a tungsten source for wavelengths from 800 to 400 nm. Topographic comparisons were made using micrographs taken with an ISI Model DS130 Scanning Electron Microscope (SEM) and an ISI Model Super IIIA SEM. The microstructural effects were compared using a computer controlled JOELCO 50A SEM with Computer Evaluated Scanning Electron Microscopy Images (CESEMI) capability.13 In the CESEMI system, a PDP 11/20 computer (Digital Equipment Corp.) is interfaced with the JOELCO 50A SEM. This equipment design allows the computer to control the electron beam of the microscope as the beam is rastered across the sample 3 RESULTSTHE GRAPHS in Fig. 1 show the results of total reflectance (diffuse plus specular reflectance) measurements made using the reflectance spectrophotometer for the untreated and cleaned samples. The overall reflectance of the untreated highlight (Step 1) area (Fig. 1a) is a rather flat curve of low overall reflectance which is indicative of a white, diffusely reflecting surface.14 The one-minute sputter cleaned sample produced a similarly shaped curve of somewhat higher reflectance, indicating a loss in diffusivity without a substantial change in color appearance. Both the thiourea sample and the four-minute sputter cleaned sample show similar gains in specularity indicating a comparative loss in the number of image particles. However, the difference in curve shapes indicates changes in the color cast appearance of the samples such that the thiourea sample may appear “warmer” due to an increase in reflectance in the longer wavelengths of the spectrum and the sputter cleaned sample may appear “cooler” due to the increase in a reflectance in the shorter wavelengths. The sample cleaned with KCN shows a dramatic increase in specularity and alteration of color tone.
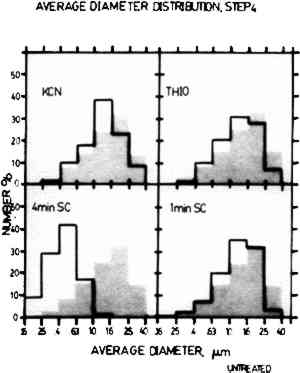
The reflectance curves shown in Fig. 1b show the results for the shadow region (Step S) of the test samples. The untreated sample has a high overall reflectance with a slightly yellowish cast. The one-minute sputter cleaned sample has somewhat less overall reflectance with a more pronounced warm color cast. The curves for the thiourea sample, the KCN sample, and the four-minute sputter cleaned sample show a similar reduction in specularity and a general flattening of the curves suggesting a white, uniformly diffuse reflecting appearance more like what would be expected in a highlight region. CESEMI was used to monitor changes in image particle size, image particle spacing, image particle distribution and the total number of particles. Due to the fact that mercury was used as a particle tag, CESEMI could only make accurate counts on Steps 4 through Shadow (Step S); for as the image particles become smaller in size and greater in number in the highlight areas, less mercury is present.15 As a result, image particles typical of highlight areas (here, Steps 1–3) cannot be easily distinguished from the underlying silver of the daguerreotype plate by this chemical analysis technique, even though they can be clearly seen in the SEM micrographs. CESEMI data from Step 4 (midtone) and Step 7 (grey shadow) will be considered in detail because the features of these steps are representative of the cleaning effects on all steps. Microstructural alteration typical of the effects for each of the cleaners are clearly shown in the secondary electron micrographs found in Figs. 6–8. The CESEMI data are not inconsistent with these micrographs; however, the micrographs give a more graphic indication of cleaning effects than is possible with CESEMI.
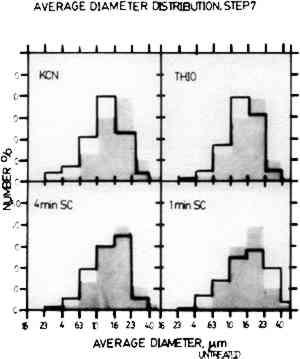
The histograms in Figs. 2 and 3 show the comparison of the average diameter distribution for the untreated sample of Step 4 and Step 7 (shown in grey) with the corresponding sample for each cleaning procedure. The average diameter distribution indicates changes in average particle size for all treatments. It should be noted that the average particle sizes are plotted on a log scale and thus small changes may appear more drastic due to histogram groupings. Further, the results are normalized and do not account for changes in the number of particles.
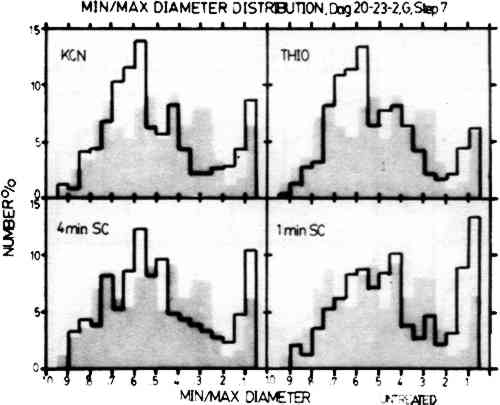
In Step 4, the particle size preservation is very good for both the one-minute sputter cleaned sample and the thiourea sample, but the treatment with KCN causes a large reduction in particle size. The results for the four-minute sputter cleaned sample show that sputter cleaning can also cause a drastic alteration in particle size if the sputtering conditions are too harsh. For Step 7, both of the sputter cleaned samples showed fairly good particle size retention. However, the results for the KCN sample The histograms shown in Fig. 4 indicate changes in particle shape plotted as the ratio of the minimum diameter to the maximum diameter of the image particles. In these histograms, round particles have a diameter ratio of 1.0 and oblong particles have a diameter ratio approaching 0. Step 7 is shown here because the untreated sample has the full range of image particle shapes found in daguerreotypes. The one-minute sputter cleaned daguerreotype shows a similar range of particle shapes with no particular shape dominant over any other. The four-minute sputter cleaned sample also shows fairly good particle shape retention, but not as good as the one-minute sputter cleaned sample. The thiourea sample and the KCN sample show a pronounced alteration in particle shapes with a rounding trend seen as the increase in the percentage of particles in the 0.7 to 0.5 min/max diameter ratio range.
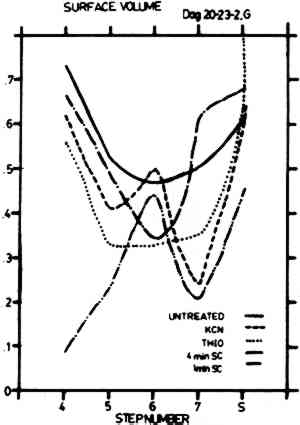
Figure 5 shows the percent volume (∑ first chords/total test length, roughly equivalent to the amount of surface covered by image particles) for Step 4 through Shadow for all cleaning treatments. It is evident that the untreated sample and the thiourea sample have similar curve shapes indicating that the thiourea may reduce particle number in a way that still allows for the overall retention of the characteristic daguerreotype appearance, even though the cleaned image will appear faded. The one-minute sputter cleaned sample shows better retention of particle number with a somewhat altered curve shape. This may result in a somewhat altered appearance due to changes in the particle geometry. Both the KCN sample and the four-minute sputter
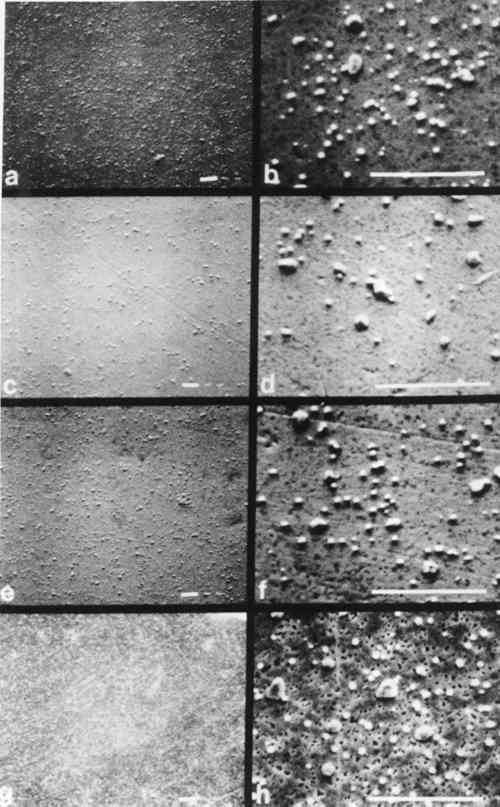
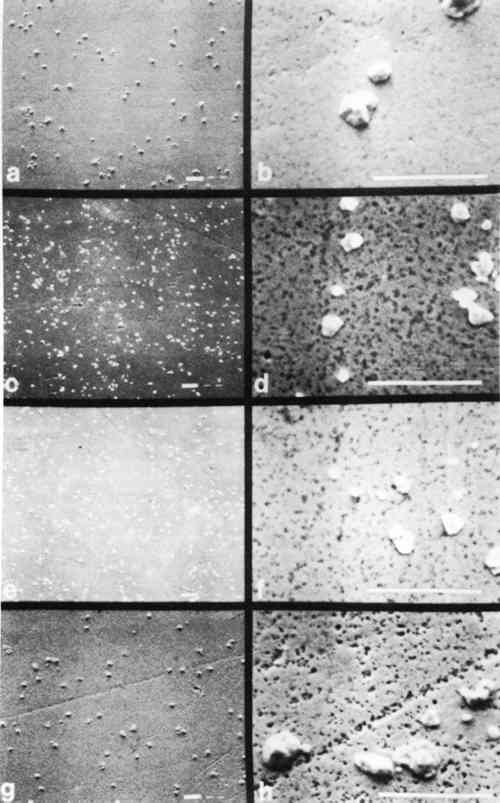
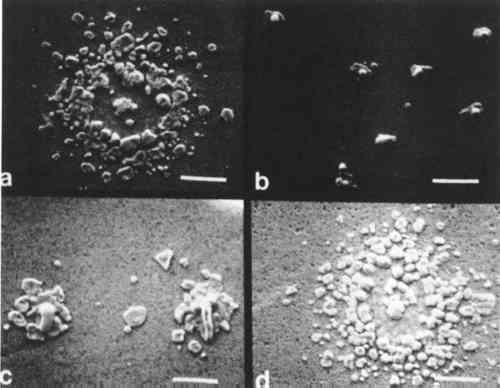
The series of micrographs in Figs. 6 and 7 show characteristic microstructural alteration due to cleaning for Step 4 and Step 7, respectively. The results for the untreated sample, the KCN sample, the thiourea sample, and the one-minute sputter cleaned sample are shown at two different magnifications. This allows for the comparison of the general features of alteration of the gross microstructure, as well as the individual image particles. There is also included a similar series of micrographs (Fig. 8) of shadow-particle agglomerates showing the effect of the cleaning procedures. These micrographs show clearly the changes in image particle geometry and distribution that are brought about by cleaning. The extreme alteration of particle shape and the increase in the number of particles that results from cleaning in KCN is especially apparent in Figs. 7c, 7d and 8b. To a lesser extent, thiourea causes similar alterations as shown in Figs. 7e, 7f and 8b. Figure 7 gives an indication of the nonselectivity of solvent cleaners, which, in this instance, causes a decrease in the number of image 4 DISCUSSIONMOST CLEANERS remove part of the original material from the object that is being cleaned and are, therefore, “damaging” to that object. The selectivity of any cleaning method is directly related to the ratio of sulfur-to-silver material removed and is thus inversely proportional to the amount of “damage” resulting from cleaning. Further, the regulation of the rate(s) of material(s) removal gives control over the amount of “damage” a cleaner might do to an object. Implicit in this is that methods offering higher selectivity and control are also more forgiving in that they increase the latitude between cleaning and irreparable damage to an object. For the daguerreian system, the ideal cleaner would remove only sulfur, or barring that, only silver sulfide, leaving the other daguerreotype constituents (Ag, Hg, Au, Cu) intact. It would also proceed at a rate that could be easily controlled. The solvent cleaners, KCN and thiourea, tend to alter unselectively both the image particles and the daguerreotype surface by dissolving unwanted silver sulfide tarnish, as well as all other daguerreotype constituents. Further, changes in particle shape and distribution resulting from these cleaners suggest that the combination of the solvent and the daguerreotype constituents makes an active chemical system which causes the random removal and redeposition of materials possibly by a mechanism like autocatalytic plating. The action of solvent cleaners tends to be nonuniform, which may be due to uneven wetting of the sample surface by the solvent, and which is apparently reduced by the addition of a surfactant (e.g., Photo Flo) to the cleaner formula.16 In keeping with the general consensus since the adoption of thiourea cleaners, these results show KCN is an unacceptable daguerreotype cleaner. Even though thiourea shows a tendency towards the unacceptable traits of KCN, the results indicate that its use might be warranted in some cases, if used with extreme caution. The work reported by Rempel5 suggested that it is possible to control the rate and selectivity of thiourea cleaners by altering pH and thiourea concentration. Thus, if thiourea cleaners are used, it is recommended that the cleaner formulation include a surfactant and that the pH and thiourea concentration be kept low. Sputter cleaning gives good retention of both microstructure and the gross optical characteristics of the daguerreotype. The microstructure shows a characteristic roughening of the substrate surface due to sputtering bombardment effects; however, this roughening is not of sufficient size to alter the optical scattering properties of the material and thus is not seen by the viewer. Potentially, it could also be controlled by The results described above show the overall trends in the cleaning effects for the same material, i.e., the same daguerreotype. It should be kept in mind that these results show the effects of the solvent cleaners at the recommended formulations. The sputter cleaning results only look at changes in sputtering time, and there has been no other attempt to optimize this process. However, the sputtering results are very promising and appear to be generally less damaging than the results for the solvent cleaners. It is hoped that further research will provide an understanding of the effects of sputtering on daguerreotypes and will also lead to a workable system for cleaning daguerreotypes. Such a system should be based on (a) daguerreotype evaluation, (b) optimization of sputtering parameters, and (c) improved control over sputtering rate and end point determination. These results do not consider the effects of repeated cleaning of daguerreotypes by any method, or of cleaning by one method followed by subsequent cleaning by REFERENCESJames L.Enyeart, “Reviving a Daguerreotype.” Photographic Journal (1970) 110:333–344 A.Swan, “Conservation Treatments for Photographs.” Image (Summer 1978) 21:24–31. A.Swan, C.E.Fiori, and K.F.J.Heinrich “Daguerreotypes: A Study of the Plates and the Process.” Scanning Electron Microscopy (1979) 1:411–423. A.Swan, “The Preservation of Daguerreotypes.” In AIC Preprints (1981). Washington, DC: The American Institute for Conservation of Historic and Artistic Works, pp. 164–172. S.Rempel, “Recent Investigations on the Cleaning of Daguerreotypes.” In AIC Preprints (1980). Washington, DC: The American Institute for Conservation of Historic and Artistic Works, pp. 99–105. M. SusanBarger, S.V.Krishnaswamy, and R.Messier, “The Cleaning of Daguerreotypes: I. Sputter Cleaning, a New Technique.” In AIC Preprints (1982). Washington, DC: The American Institute for Conservation of Historic and Artistic Works, pp. 9–20. V.Daniels, “Plasma Reduction of Silver Tarnish on Daguerreotypes.” Studies in Conservation (1981) 26:45–49. These are postulated chemical reactions. In each, (s) indicates a solid species and (g) indicates a gaseous species. S.D.Humphrey, American Handbook of the Daguerreotype (1858). New York: S.D. Humphrey, pp. 2–51. The extreme highlight area of a daguerreotype (in this case, Step 1) has ∼200,000 image particles/mm2 that range in size from ∼0.1–0.8 μm. The number of image particles decreases and their spacing increases as the apparent density of the daguerreotype increases (or as it begins to appear darker when viewed as a positive). Image particle size usually does not exceed 1 μm in diameter, except in the extreme shadow area of the daguerreotype. The extreme shadow (here, step S) has characteristic particles referred to as “shadow particle agglomerates.” A shadow area usually has >100 shadow particle agglomerates/mm2 that may have diameters approaching 50 μm. J.M.Eder, History of Photography (1945). New York: Columbia University Press, 4th Ed., p. 254.
RobertTaft, Photography and the American Scene (1938). New York: Dover Publications, Inc., pp. 451–452. E.W.White, H.A.McKinstry, and G.G.JohnsonJr., “Computer Processing of SEM Images.” Scanning Electron Microscopy/1968. Proceedings of the Symposium on the SEM: The Instrument and Its Applications (1968). Chicago: IIT Research Institute. E.W.White, K.Mayberry, and G.G.JohnsonJr., “Computer Analysis of Multichannel SEM and X-Ray Images from Fine Particles.” Journal of Pattern Recognition (1972) 4:173–193. Total reflectance (diffuse + specular) as collected in an integrating sphere and measured by a spectrophotometer will deviate from 100% according to both the characteristic absorption of the material being measured, as well as the microstructural state of the material. In the case of a daguerreotype, diffuse reflectance increases as image particle spacing decreases and as the number of image particles increases. An increase in diffuse reflectance is always accompanied by some loss of reflectivity due to light absorption. A detailed discussion of the relationship of daguerreotype microstructure and optical properties can be found in: M.S. Barger, R. Messier, and W.B. White, “A Physical Model for the Daguerreotype.” Photographic Science and Engineering (1982) 26(6) (in press). M. SusanBargerThe Daguerreotype: Image Structure, Optical Properties, and a Scientific Interpretation of Daguerreotypy. Doctoral Dissertation (1982). The Pennsylvania State University. T.J.Collings and F.J.Young, “Improvements in Some Tests and Techniques in Photographic Conservation.” Studies in Conservation (1976) 21:83–84. M. SusanBarger, Bibliography of Photographic Processes in Use Before 1880. Their Materials, Processing, and Conservation (1980). Rochester, NY: Rochester Institute of Technology, pp. 113–114.
 Section Index Section Index |