THE RETENTION OF ORGANIC SOLVENTS IN PAPERJ. S. Arney, & L. B. Pollack
5 EXPERIMENTALMaterials: The rag and newsprint papers were commercial papers with cold extraction pH values of 6.7 and 5.0 respectively. The solvents were Fisher, Inc. reagent grade. Solvent Treatment: Oven-dried samples of paper (45 to 55 mg) were conditioned for 72 hours at 50% RH, 20�C, and placed in beakers containing 25 ml of solvent. After 15 minutes, the samples were removed from the beakers, blotted to remove excess solvent, and dried under the conditions described in Tables I and II.
Solvent Analysis: Although a gravimetric method of analysis is often used to determine the solvent content of cellulosic materials,3–11 such an analysis is applicable only under anhydrous conditions. At 50% RH, both solvent and moisture can contribute to the weight of a paper sample. Thus, we chose an analytical The paper sample to be analyzed was place in a glass tube fitted with a septum cap, and 150 μl of an extraction solvent, containing 1.00% by volume of an internal standard, was added. The tube was allowed to condition for 48 hours at room temperature to insure complete extraction of the solvent from the paper.6 Following this extraction period, a sample of the solution (about 100 μl) was withdrawn from the tube and injected onto a 15 foot Carbowax 20M column. Table IV shows details of the analysis for each solvent. TABLE IV ANALYTICAL SYSTEMS FOR SOLVENT DETERMINATION WITH A 15 FOOT CARBOWAX 20M GC COLUMN Peak heights for the solvent and the internal standard were measured from the GC trace, and the percent solvent content of the original paper sample was calculated as follows.
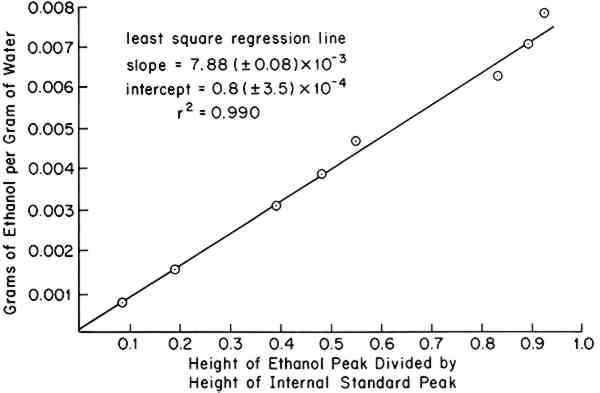
Sensitivity and Precision: Figure 1 shows a typical calibration curve obtained from 100 μl injections of standard solutions. The least-squares intercept was found to ACKNOWLEDGEMENTSTHIS RESEARCH was supported by a grant from the Andrew W. Mellon Foundation. |