SOME APPLICATIONS OF INFRARED SPECTROSCOPY IN THE EXAMINATION OF PAINTING MATERIALSRichard Newman
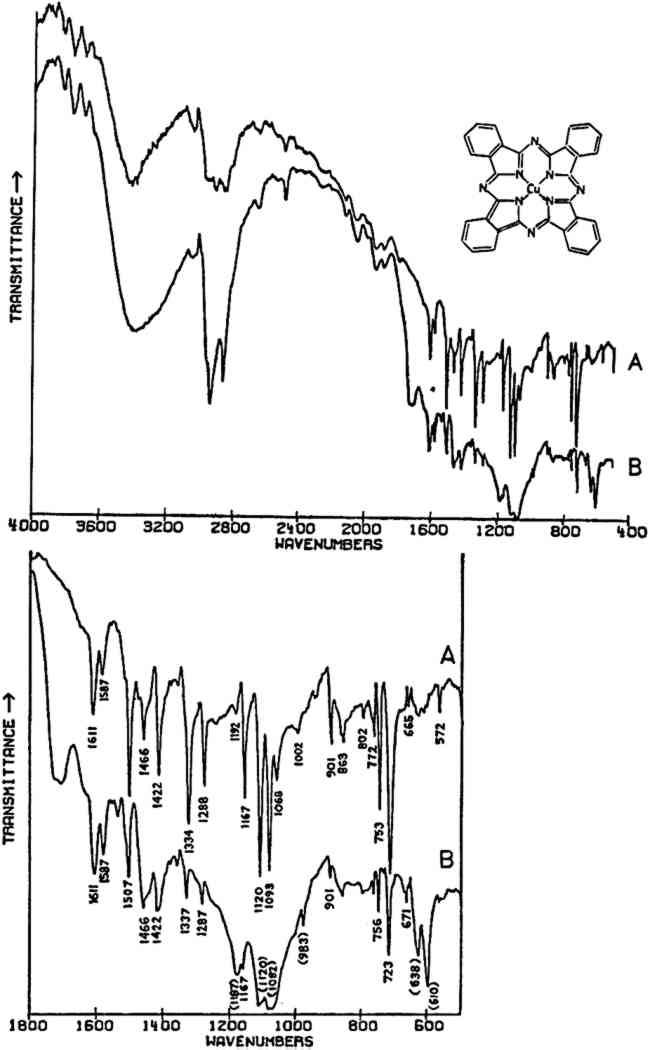
2 APPLICATIONS2.1 Sample Preparation and InstrumentationALL SAMPLES were crushed and mixed with spectrographic grade KBr and pressed into 1.5 mm diameter pellets using a vacuum pump and Perkin-Elmer microdie. The samples were run with the aid of a Perkin-Elmer 3X beam condensor. According to Perkin-Elmer, sample concentrations as small as 10 μg in 1.5 mm KBr pellets will provide good spectra,21 although in preparing the spectra presented in this paper, sample sizes were usually several times greater than this (up to approximately 50–60 μg in a few cases). The spectra were collected on a Nicolet 7199 FT-IR spectrometer (Nicolet Instrument Corp., Madison, Wisconsin) equipped with a Zeta digital plotter.22 The spectra were obtained in the 4000–400 cm−1 range using a liquid nitrogen-cooled HgCdTe detector. The resolution in all cases was 4 cm−1, and the number of scans either 128 or 256. All of the spectra were automatically ratioed by computer against a blank KBr pellet. N2 was continuously flowed through the sample chamber in order to eliminate interference from atmospheric H2O and CO2. Residual water not ratioed out is the cause of the sharp band(s) appearing in several spectra at 670–690 cm−1. Plotting of the spectra was done under the control of the computer. For more convenient comparison of separate spectra or portions thereof various manipulations Particularly with inorganic compounds of high refractive indices relative to the matrix material (for KBr, n = 1.56), the quality of the spectra may be very poor due to scattering and reflection losses if the particle size is much greater than the wavelength of the incident radiation.23 This scattering and reflection causes anomalies in the relative intensities of absorption bands, anomalies which are not entirely eliminated until the particle size is considerably smaller than is normally practically obtainable. In an attempt to reduce these effects, the samples studied here were crushed as finely as possible before mixing with the salt, but some lack in the reproducibility of relative intensities of bands from sample to sample of a given material would be expected since particle sizes are probably still rather variable. There are certain other anomalies that may on occasion occur in the spectra of materials prepared in KBr matrices,24 but these are probably not of much significance in the spectra here recorded. Theoretically, the pigment samples may be largely recovered from the pressed pellets by dissolving away the KBr salt with water. This is a very tedious operation, but it could be undertaken if the amount of sample available were very limited and other types of examination were necessary. 2.2 Modern Synthetic Organic Pigments: Phthalocyanine BluesIN THIS CENTURY, literally hundreds of synthetic organic pigments and dyestuffs have been created, a few of which are currently routinely used by artists. One of the more widely used class of these pigments are the phthalocyanine blues and greens which were first introduced commercially in the 1930's.25 Phthalocyanine blue, C32H16N8Cu (the structure is shown in Fig. 1), exists in polymorphic forms,26 the two most common of which are designated α and β. Although the polymorphs may be prepared in well-crystallized forms, amorphous forms are actually preferred by color manufacturers because of their more suitable properties, and consequently X-ray diffraction data may be unobtainable.27
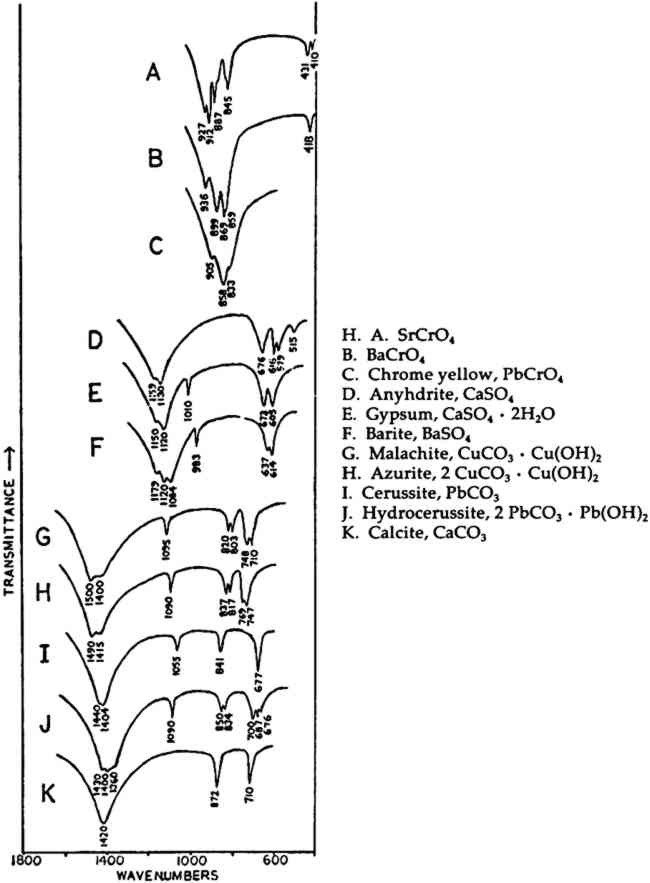
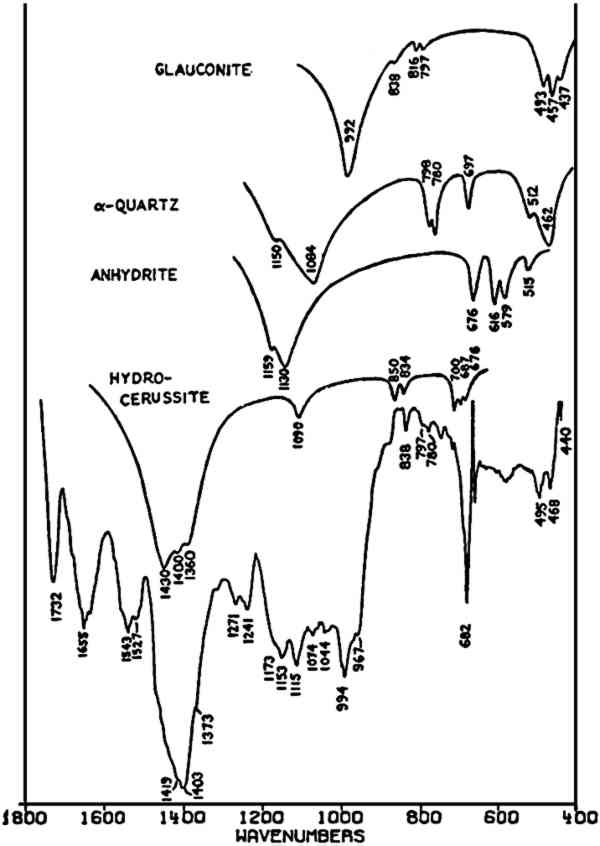
In the mid-infrared region, the phthalocyanines give very distinctive spectra which (particularly below about 1700 cm−1) contain many sharp bands due to stretching deformations of the aromatic ring system carbon-carbon bonds, and in-plane and out-of-plane bends of the carbon-hydrogen bonds in the ring system.28, 29Fig. 1A shows the full spectrum of a dry copper phthalocyanine pigment and an expanded portion of its spectrum. Fig. 1B reproduces the spectrum of a copper phthalocyanine oil paint film. The oil medium produces bands at 1715–1732 cm−1 and probably contributes to a general increase in absorbance between 1200–1000 cm−1. This paint is also extended with BaSO4, which is often the case with the strongly tinting phthalocyanines; the bands at 1186, 1120, 1082, 983, 638, and 610 cm−1 are due to this sulfate compound (see Section 2.C). In spite of these interferences, the pigment is readily identifiable, and the polymorph may be definitely established as α on the basis of the sharp band at 723 cm−1, due to out-of-plane Infrared spectroscopy is a technique widely employed in the analysis of modern synthetic colorants,30 and reference spectra of many of the important pigments and dyestuffs have been published.31 2.3 Inorganics Containing Polyatomic Ions2.3.1 Theoretical Basis for the Infrared Spectra of Polyatomic IonsMANY TRADITIONAL and modern inorganic pigments, both mineral and synthetic, contain polyatomic ions. Those ions most frequently encountered include carbonate (malachite; azurite; blue verditers; calcite; cerussite; hydrocerussite); sulfate (gypsum; anhydrite; barite or ‘blanc fixe’); and chromate (chrome yellows; chrome orange; chrome greens). In compounds of these types, the binding forces between atoms within the polyatomic ions are appreciably stronger than those between these ions and the metallic cations in the crystal lattice. As a consequence of this fact, different compounds containing a specific polyatomic ion will exhibit spectra which display general similarities in the mid-infrared frequency range. The fundamental vibrations of polyatomic ions may be divided into two classes: (1) internal vibrations of the atoms comprising the ion which cause stretching of the bonds between these atoms or deformations of the bond angles (bending); and (2) external vibrations, which are either restricted translations of the entire ion or rotations (usually referred to as librations) of the ion about a certain axis and do not cause distortions of the equilibrium bond distances and angles within the ion.32 The external or lattice vibrations, combined with similar displacements of the metallic ions, usually occur at relatively low frequencies (below 300 cm−1) in the far-infrared region. The internal vibrations involving the covalently-bonded atoms of the polyatomic ion occur at higher frequencies in the mid-infrared region (but usually below 1500 cm−1). A non-linear polyatomic ion possesses 3N-6 fundamental vibrational modes, where N is the number of atoms in the ion. Ideally, each type of ion has a certain degree of symmetry, and considerations of this symmetry cause some of the fundamental modes to be degenerate, that is, to occur at identical frequencies. In addition, not all of these modes may be active in the infrared region, since a change in the ground-state dipole moment of the configuration is necessary if absorption in the infrared is to occur. On the basis of studies of polyatomic ions in isolation, in which their ideal symmetries are preserved, these fundamental frequencies have been determined for many ions.33 By convention, the fundamental vibrational frequencies are designated by the usual symbol for frequency, v, with numerical subscripts which are assigned according to symmetry considerations and, for vibrations possessing the same symmetries, in order of decreasing frequency. If the polyatomic ion becomes part of a crystal structure, to a first approximation lattice vibrations may be ignored in considering the internal vibrations. However, if this approximation were correct, then the internal vibrational absorption bands would be very sharp and display little breadth; in reality, these bands are always observed to be rather broad. The broadening is caused by various couplings of internal vibrations and lattice vibrations.34 The equilibrium potential energy field of the crystal may be distorted by a lattice vibration, one result of which is the splitting of degenerate internal The symmetry of a polyatomic ion in the crystal lattice is usually lower than its ideal symmetry due to anisotropic interactions with surrounding cations or neighboring anions, and these interactions also serve to remove the ‘equivalency’ of some of the bonds within the ion, thus causing splitting of degenerate modes. The potential energy field of the crystal lattice ultimately determines the exact positions of the fundamental vibrations of a given polyatomic ion. Certain regular shifts in these bands have been observed for some polyatomic ions. For example, in carbonates and sulfates, there is a regular relationship between the cationic radius (for cations of similar electronic structures) and the position of the fundamental frequencies, an effect which is probably due to increasing compression of the atoms in the polyatomic ion as the cation increases in size; this compression changes bond strengths.35, 36, 37 Thus, as a consequence of several factors, the fundamental vibrational frequencies of polyatomic ions in a crystalline environment cannot be expected to be identical from one compound to another. Furthermore, the same number of fundamental vibrations would not always necessarily be visible, since degeneracies may be removed to various extents depending upon the precise structure and even the conditions under which the compound crystallized. For identification purposes, a general pattern of intensities and frequencies is sought. In Fig. 2, the vibrational bands of 5 carbonates, 3 sulfates, and 3 chromates are shown.38 The general spectral appearance of these different ions will be evident from these spectra, but the often small but significant variations in the exact frequencies at which the bands will be found according to the particular compound should also be noted.39
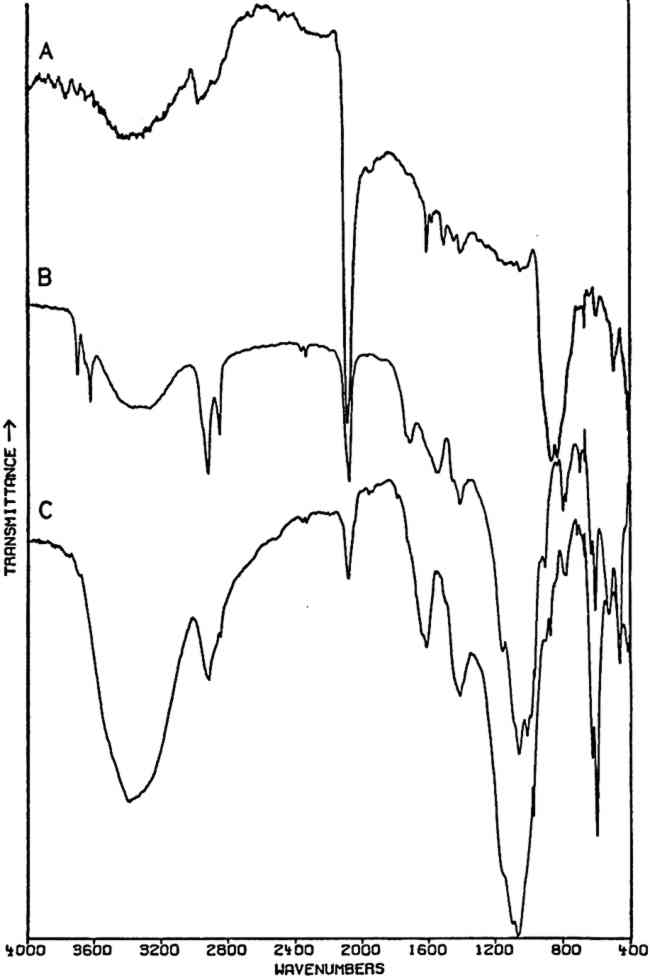
2.3.2 Specific ApplicationsCHROME AND ‘Brunswick’ green pigments, which contain two or more different polyatomic ions, may be at least partly characterized by infrared spectroscopy. These mixed pigments, consisting of Prussian blue, chrome yellow, and often BaSO4 and/or China clay (kaolinite) as extenders, were widely used in the 19th and early 20th centuries.40, 41 Two samples of ‘Brunswick’ greens with high BaSO4 contents were studied. X-ray diffraction patterns of the two pigments showed only BaSO4 unambiguously. Emission spectrographic analysis indicated that both contained minor amounts of Pb, Cr, and Fe. Fig. 3B is the spectrum of a green pigment found during the excavation of the site of a 19th-century paint factory. Fig. 3C is the spectrum of a green pigment taken from a panel painting probably of 19th century origin. Chrome green pigments of very low BaSO4 content have also been produced, and the spectrum of one of these is given in Fig. 3A.
Prussian blue may be identified in all three by the band at 2070–2080 cm−1, which is due to vibration of C ≡ N in the ferrocyanide ion, Fe(CN)64− This is a strong sharp absorption which is particularly suited to the identification of Prussian blue, since it occurs in a region where virtually no other commonly-encountered organic or inorganic group absorbs. Prussian blues are often difficult to analyze by X-ray diffraction when Cu Kα radiation is used because of high absorption of this radiation by Fe. But the ferrocyanide radical is readily identifiable by infrared spectroscopy even when the blue pigment is a minor component in a given sample, as is the case with the green pigment in Fig. 3C, in which it is probably present to an extent of less than 5% by weight (estimated by emission spectrographic analysis).
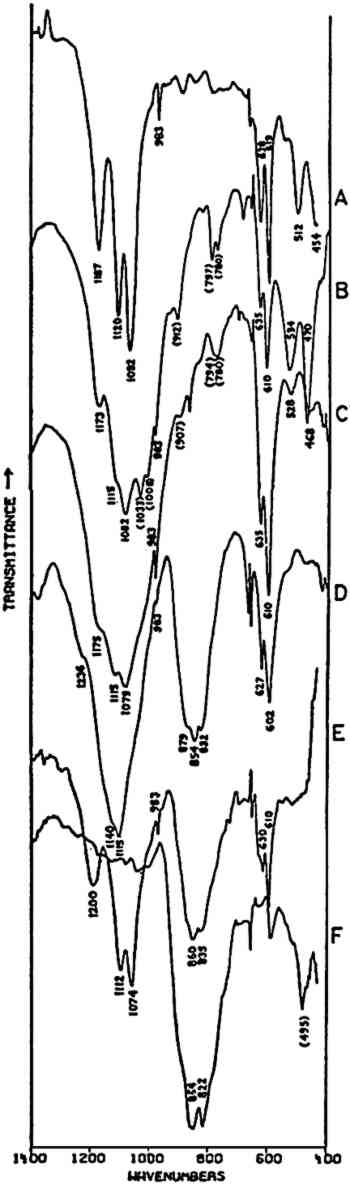
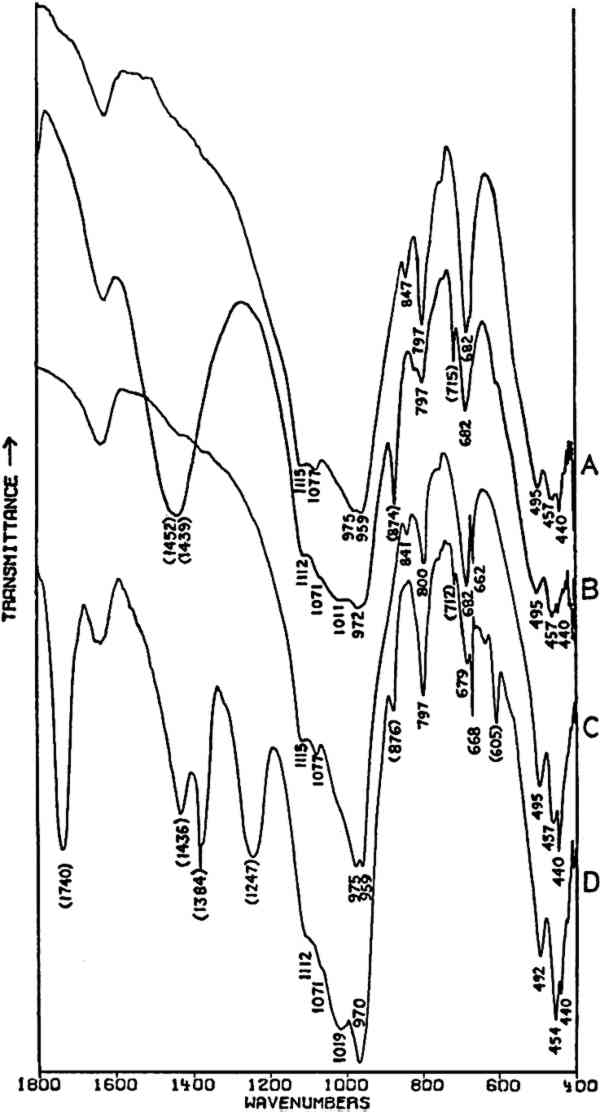
Fig. 3A and 3B are spectra of dry pigments, whereas the pigment in Fig. 3C contains a carbohydrate binding medium. This accounts for the broad hydroxyl band Precipitated PbCrO4 (chrome yellow) contains isolated CrO42− ions. This tetrahedral ion possesses nine fundamental vibrations, several of which are degenerate in the free ion.42 The absorptions of the chromate ion in the chrome green pigment (Fig. 4F) occur at 854 and 832 cm−1, both of which are due to Cr-O stretching deformations; the shoulders which occur on both the low and high frequency sides of this pair may be due to splitting of the degenerate modes by the crystal field. Cr-O bending deformations occur at lower frequencies, usually below 400 cm−1, and consequently are not visible here. Fig. 4D and 4E represent two chrome yellow pigments; the principal bands in 4D occur at 854 and 832 cm−1, and those in 4E at 860 and 835 cm−1. In both cases, several shoulders bands are more or less evident.
Unfortunately, in the presence of major accounts of SO42−, the CrO42− ion does not appear to be readily identifiable. For example, there is no evidence of the stretching absorptions in the green pigments whose spectra are given in Fig. 4B and 4C. This is not surprising as these absorptions were barely discernible in a simple physical mixture made in the laboratory of 20% by weight of PbCrO4 and 80% BaSO4 (spectrum not shown). The PbCrO4 content of the pigment in Fig. 4C was estimated by emission spectrography to be approximately 10–15% by weight. The sulfate ion, SO42−, possesses the same symmetry in its free state as the chromate ion, and also gives rise to four fundamental frequencies and nine total fundamental vibrations:43
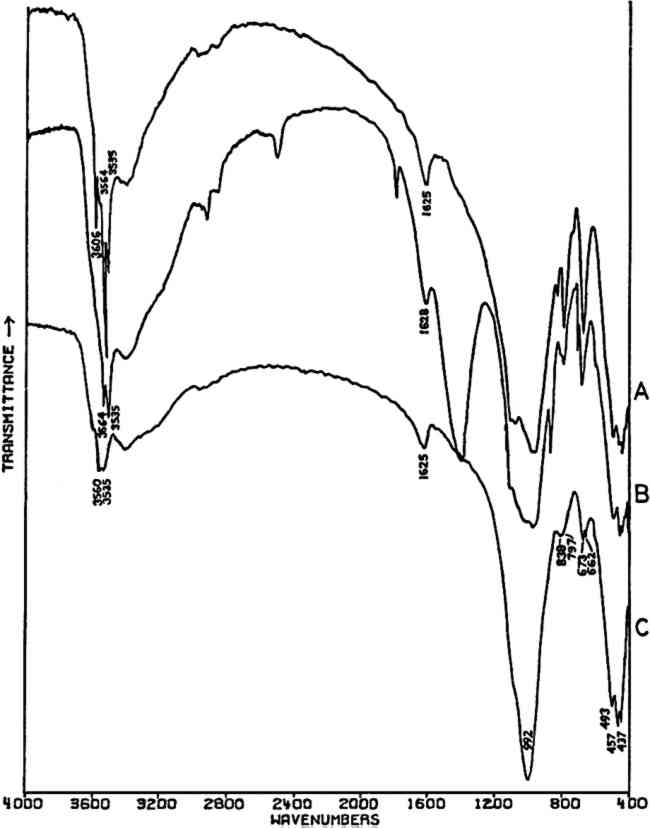
Both of the ‘Brunswick’ greens (Fig. 4B and 4C) also appear to contain α-quartz, two of whose transverse lattice vibrations produce the pair of absorptions at 794–797 and 780 cm−1 in the samples.44 The 1033 and 1008 cm−1 bands in the green pigment in Fig. 4C occur in positions in which certain silicate minerals (particularly clays) absorb and may be due to such a component.45, 46 As noted above, ‘Brunswick’ greens were also extended with China clay, and this may be the case with this green pigment. This small group of spectra indicates the unambiguous possibilities of identifying TABLE I VIBRATION FREQUENCIES OF MINERAL AND PRECIPITATED BaSO4 (IN WAVENUMBERS) 2.4 Green Earths2.4.1 Composition of the Silicate Minerals in ‘Green Earth’THE PIGMENT ‘green earth’ has been available since ancient times, and in the medieval and Renaissance periods was probably most widely used in the underpainting of flesh tones by tempera painters.47 C. Grissom has previously discussed the use of infrared spectroscopy in the study of green earths and has presented spectra of green earth pigments collected from several sources.12 The colorant in this pigment is one of two layer silicate minerals, glauconite or celadonite. Although very similar in chemical composition, these two minerals are formed under different geological conditions and would not normally occur together: glauconite is found in marine sediments, whereas celadonite is a secondary mineral found in certain basalts.48 Both minerals belong to the mica group. The composition of this group of silicate minerals consists of a layer of octahedrally-coordinated ions (Al3+, Mg2+, Fe2+, Fe3+) sandwiched between two sheets of SiO4 tetrahedra whose unshared apical oxygen atoms are directed inward. The tetrahedral silicon in these layers may be partially replaced by aluminum. Hydroxyl groups are located in the centers of the hexagonal rings formed by the apical oxygen atoms in the SiO4 sheets. Successive groups of these three-layer sandwiches are held together by K+ ions, which may be partially replaced by water or metallic ions. Minerals of the type to which celadonite and glauconite belong are referred to as dioctahedral 2:1 layer silicates (“dioctahedral” since the total number of octahedrally-coordinated Neither glauconite nor celadonite is a mineral of one specific composition, and some members of the two may very closely approach each other in composition.50 X-ray diffraction patterns of both are generally indistinguishable and are of a type (designated 1M) widely occurent in the minerals of sedimentary and low-grade metamorphic rocks.51 2.4.2 Infrared Spectra of the Green Earth MineralsTHE SPECTRA of two dry green earths (both celadonite) and of mineral glauconite are given in Fig. 5A–C. The second of the dry pigments contains calcite (confirmed by X-ray diffraction). The presence of interlayer water (not water of hydration) is indicated in all three by the peak at about 1620 cm−1. The principal broad absorption in all samples, which is centered at about 1000 cm−1, is due to Si-O lattice vibrations. There are many possible vibrations of this general type which may occur in the tetrahedral layer structure, and these contribute to the fine structure of this broad band. The exact positions of these peaks and shoulders can be used to distinguish between various individual species.52, 53 The celadonites have a group of four peaks, the most intense of which is at 970–975 cm−1. Farmer and Russell identified three of these peaks and ascribed them to particular Si-O deformations in-plane (972 and 1075 cm−1) and perpendicular to the silicate layer (1105 cm−1).54. The celadonite from which their spectrum was taken had no substitution in the tetrahedral Si. In glauconites, the fine structure in the Si-O band may largely disappear, leaving as in the case of the sample of Fig. 5C only one broad band (with possible poorly resolved shoulders).55 This is due to a lowering of symmetry in the silicate layer, which is the result of substitution of Al for Si in some of the SiO4 tetrahedra. Celadonite contains from 0–0.2 Al with Si constituting the remainder up to 4 in the unit formula; glauconite, on the other hand, contains from 0.3–0.8 Al, and the appearance of the principal Si-O band(s) near 1000 cm−1 is particularly sensitive to even such relatively small differences in substitution.
The other absorption bands of interest in identifying these minerals occur below 500 cm−1 and are known to be very sensitive to variations in the octahedrally-coordinated ions in these structures, and particularly to Fe3+. The triplet of bands found by Farmer and Russell at 494, 457, and 442 cm−1 occurs in virtually the same position in the two dry green earth pigments (celadonite) and in the glauconite sample, which indicates a similarity in ocathedral ion compositions. This is further confirmed by the nearly identical positions of the high-frequency R-OH stretching bands (at about 3560 and 3535 cm−1).56
Fig. 6D is the spectrum of a green pigment from a 2nd-century (?) Coptic carved limestone figurine. The stone and pigment had been consolidated with an unidentified binding medium which was leached several times with CCl4 before the sample was prepared for infrared spectroscopic analysis. The spectrum shows calcite bands (probably from the stone), and bands probably due to the binding medium, but the distinctive pattern of celadonite is nevertheless readily evident. Table II summarizes the absorptions of the celadonites discussed here (see also Fig. 6).
TABLE II VIBRATION FREQUENCIES OF SEVERAL CELADONITES (IN WAVENUMBERS) A complex spectrum (Fig. 7) is also included here to indicate the difficulties encountered with paint samples containing many materials. This sample was taken from the underpainting of the flesh in a 16th-century Italian egg tempera painting. Relatively little green pigment was present in the sample, and the principal bands of the recorded spectrum indicate CO32− and SO42− ions, probably to be ascribed respectively to lead white (apparently hydrocerussite in this case) and anhydrite (from the underlying ground layer); α-quartz may also be present in the sample. The broad band centered at 994 cm−1 and the triplet of bands at 495, 468, and 440 cm−1 may be due to the suspected green earth pigment. The band at 1655 cm−1 may be assigned to C = O stretching in amide bonds (e.g. the protein-containing paint medium). The following list summarizes these assignments:
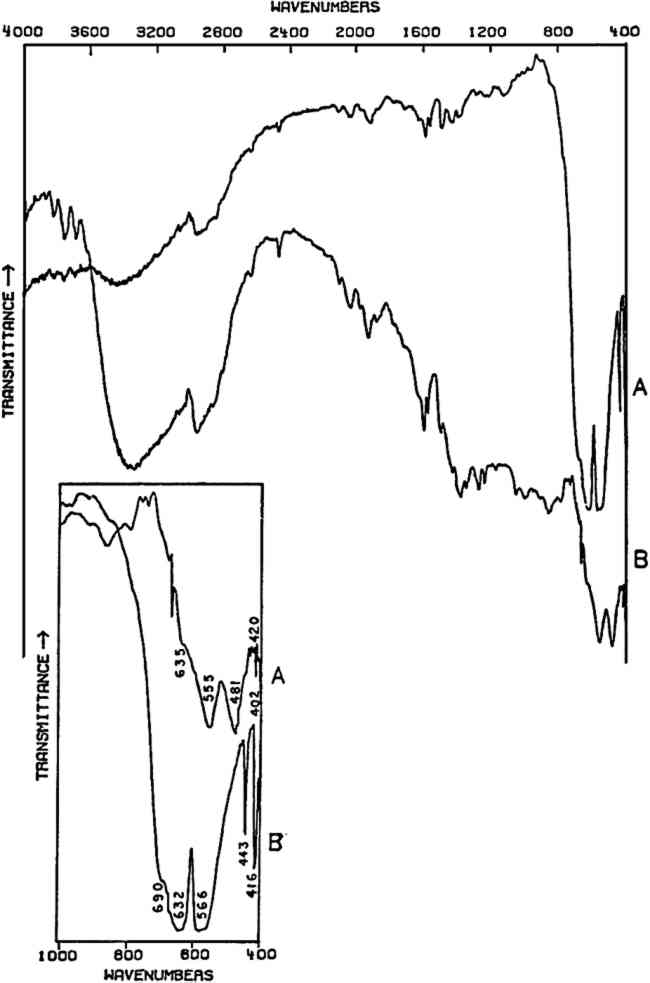
2.5 Amorphous Inorganics: Cr2O3 and ViridianTHE ELEMENT CHROMIUM was discovered by Vauquelin in 1797. The opaque oxide, Cr2O3, was known at that time and in 1809 was suggested as a ceramic glaze colorant. The transparent hydrated oxide, Cr2O33H2O (viridian), may first have been introduced as an artists' color in 1838; however, both pigments were apparently not widely available until after about 1862.57 Both of these oxides have a low order of crystallinity and consequently do not give X-ray diffraction patterns,58 but both give characteristic infrared spectra below 800 cm−1 which may be used for identification purposes (Fig. 8). The broad band centered at approximately 3400 cm−1 and the sharp peak(s) around 1600 cm−1 in viridian are due to the water of hydration in its structure.
As noted earlier, the infrared spectra of oxides, sulfides, and other compounds of high refractive indices are often poor due to scattering losses, and in addition the number of absorption peaks as well as their positions may be profoundly affected by particle dimensions and shape and the refractive index of the matrix material.59 The Cr2O3 dry pigment whose spectrum is given here was not further ground, but its spectrum does compare favorably with spectra published elsewhere in which sample preparation included careful grinding.60, 61 In Cr2O3, each O2− is coordinated by four Cr3+ in a distorted tetrahedron.62 The strongest bands, at 632 and 566 cm−1 in Cr2O3, do not correspond to specific O2− displacements and are probably due to various combinations of O2− and Cr3+ displacements in the lattice. The pair of sharp bands at 443 and 416 cm−1 corresponds to two specific O2− displacements in the lattice. The hydrated oxide (viridian) has not been studied, but the absorptions are probably due to similar types of displacements, whose frequencies have been shifted due to the presence of water in the structure. |