THE INFLUENCE OF DEACIDIFICATION ON THE DETERIORATION OF PAPERJ.S. Arney, A.J. Jacobs, & R. Newman
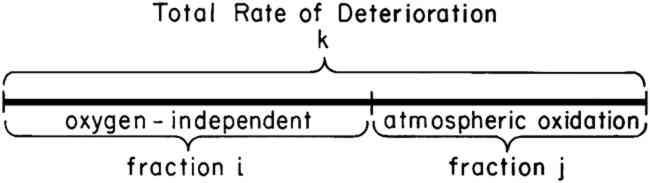
2 PRESENTATION OF RESULTSIN A PREVIOUS PUBLICATION, we have described a series of accelerated aging experiments that allow one to determine the contribution of atmospheric oxidation to the total rate of paper deterioration.6,7 The results of these experiments may conveniently be represented as shown in Figure 1 in which the total rate of degradation is shown as the length of the line labeled k. The percentage of this total rate that results from attack by oxygen is shown as fraction j. The remaining segment of line k has been labeled as oxygen-independent degradation, fraction i, and represents those processes, such as hydrolysis, that do not involve atmospheric oxygen. The reader is referred to previous publications6,7 for descriptions of the experimental procedures used to determine the values of i and j.
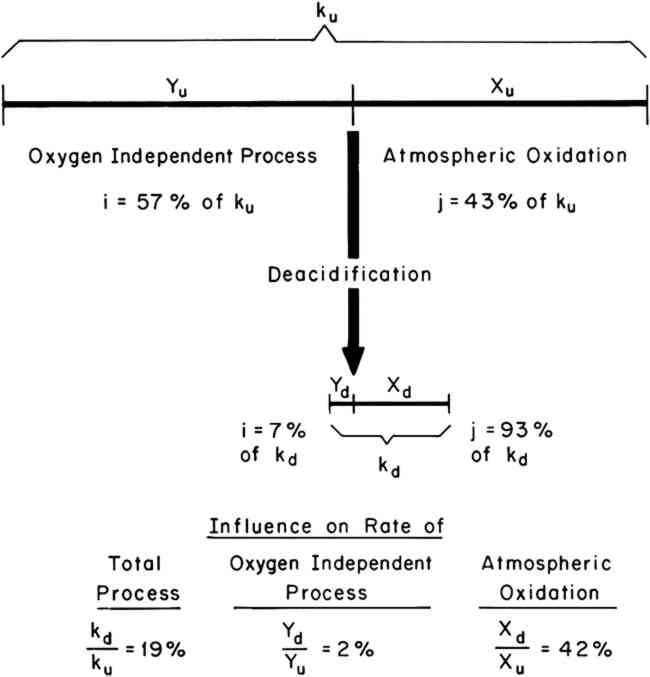
Values of the fractions i and j, expressed as percentages of the overall rate, k, have been determined for both a 100% cotton rag paper and a newsprint subjected to accelerated conditions of aging at 90�C and 100% R.H. From previously reported experiments,6,7 it was found that the 100% R.H. condition resulted in approximately equal contributions from the atmospheric oxidation and oxygen-independent processes. Therefore, in order to examine the influence of deacidification on both processes, the 100% R.H. condition was chosen for the accelerated aging experiments. Values of i and j for both types of paper were determined both with respect to the rate of loss of tensile strength and the rate of change in reflectance at 500 nm. Experiments were performed both on untreated papers and on deacidified papers in order to determine the influence of deacidification on the fractions i and j. The results are summarized in Table I. Table I Relative Contribution of Oxygen-Independent (i) and Atmospheric Oxidation (j) Processes to the Total Rate of Degradation at 90�C and 100% R.H. Before and After Deacidification As an example, consider the rate of tensile strength loss in the rag paper. Prior to deacidification it was determined that 57% of the rate of tensile strength loss was caused by oxygen-independent processes (iu = 57%), and 43% was caused by atmospheric oxidation (ju = 43%). After deacidification, values of id = 7% and jd = 93% were obtained for the rag paper. Thus, the effect of deacidification on the rate of tensile strength loss was to increase the relative importance of atmospheric oxidation and decrease the relative importance of the oxygen-independent process. One must exercise caution in the interpretation of these results and recall that the values of i and j for any single paper must always add up to 100%. Referring to Figure 1, an increase in j and a decrease in i simply means that the dividing point between i and j was shifted to the left. Whether the rate of atmospheric oxidation was increased or not cannot be determined from the data in Table I alone. One must also determine the influence of deacidification on the total rate of degradation; the length of line k. Experimentally, the length of kd (total rate of degradation of the deacidified paper) divided by the length of ku (total rate of degradation of the untreated paper) can be determined by dividing the time required for the untreated paper to reach a given level of degradation by the time required for the deacidified paper to reach the same level of degradation.9,10 Thus, values of kd/ku were determined for both the yellowing and the loss of strength of both the rag and the newsprint papers. The results are summarized in Table II. For example, the value of kd/ku is 19% for the loss of tensile strength in the rag paper. This means that after deacidification the rag paper lost strength 19% as fast as before deacidification. Thus the length of the line marked k in Figure 1 decreased significantly. Table II Experimental Values of the Rate (kd) of Degradation of Deacidified Paper Divided by the Rate (ku) of the Untreated Paper The data in Tables I and II may be understood by referring to the illustration in Figure 2. The length of the two horizontal lines represent the total observed rates of embrittlement, ku and kd, of the untreated and deacidified rag papers. The two lines are divided, as discussed above, into the two fractions of the deterioration process, i and j, of lengths X and Y. From this schematic illustration it can be seen that the rate of the oxygen-independent process (the length of line segment Y) is markedly decreased as a result of deacidification. In addition, it can be seen that the rate of the atmospheric oxidation process (the length of line segment X) is also decreased. Furthermore, the length of each line segment (Xu, Yu, Xd, and Yd) can be
A similar graphic treatment of the remaining data in Tables I and II resulted in the values of Xd/Xu and Yd/Yu reported in Table III. Table III Calculated Influence of Deacidification on the Rates of the Atmospheric Oxidation and Oxygen-Independent Processes in Rag and Newsprint Papers at 90�C, 100% R.H. |