DETERMINATION OF IRON AND COPPER IN 18th AND 19th CENTURY BOOKS BY FLAMELESS ATOMIC ABSORPTION SPECTROSCOPYLucia C. Tang
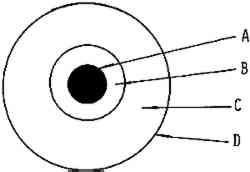
2 EXPERIMENTAL2.1 ApparatusA Perkin-Elmer model AD-2 electronic ultramicrobalance was used for the accurate weighing of the paper samples. A Varian Techtron AA-6 spectrophotometer was used with a model 90 carbon rod atomizer and a potentiometric A-25 recorder. The standard graphite cup was supported by two side electrodes. Instrumental operating parameters25 are shown in Table I. The solid samples were introduced into the cup atomizer with tweezers. Standard solutions were inserted into the cup atomizer by means of a 5 μl Oxford pipet. TABLE I INSTRUMENT PARAMETERS AND ALTERNATIVE ABSORPTION LINES 2.2 Preparation of SamplesThe paper samples were obtained from 8 books of 18th and 19th century origin and various papers. 2.2.1 Book Paper FoxingThis was of three basic varieties: a) light brown spots, b) dark brown spots, as shown in Figure 5, and 3) dark-centered spots, fading toward the periphery, as shown in Figures 1 and 3. Samples were taken of all three for analysis, limited to the unprinted book spaces. Control samples were taken from the same pages as the foxing samples, also limited to unprinted book spaces.
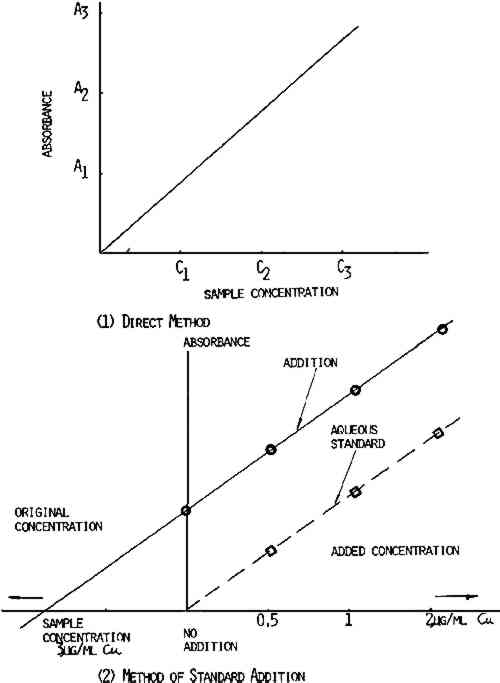
2.2.2 Handmade Paper FoxingThis appeared as light or dark brown spots and was found on laboratory handmade paper. Samples of the foxed spots were analyzed for iron and copper content. When possible, a titanium punch was used to cut 2.8mm diameter samples from the books and papers. However, foxed spots showed increased brittleness as compared to the nonfoxed areas—often disintegrating on sampling. To eliminate this problem, foxed spots were cut out using a small scalpel blade and tweezers. The weight of samples taken varied from 0.05 to 0.8mg. Where the spots were very dark, a smaller sample was adequate. 2.3 Standards and Calibration ProceduresThe distilled water or tap water was purified by passing it through a cation exchange cartridge (Universal cartridges, No. 1506–20, Cole Parmer Instrument Co.) and a second cation exchange cartridge (Research cartridges, No. 1506–30, Cole Parmer Instrument Co.) to remove all metal ions. Throughout this study, 1000 ppm atomic absorption standards (Fisher Chemical Co.) were used. Calibration standards of 0.5, 1, and 2.0 μg/ml Cu and 20, 50, and 100 μg/ml Fe were prepared by diluting the standard with deionized water. In the calibration of the atomic absorption instrument, there are two accepted methods—the direct method and the addition method. The method of choice depends on the chemical composition, the sample, and also the method of sample preparation. The When the direct method is used, the carbon rod atomizer is calibrated using known concentration of metals in aqueous solution. The peak height or the absorbence signal value is plotted versus the concentration of the element being analyzed. The sample absorbence signal is compared to the absorbence signal of the calibration standard, as shown in Figure 2. However, when a direct comparison is made between dilute aqueous standards and a sample prepared by wet procedure using acid, a complex matrix may be formed such that viscosity, dissolved salt content, and surface tension will cause chemical interferences in this situation. The addition method is used and a calibration curve is run by adding known amounts of each element to the sample, as shown in Figure 2. Since the slope for the addition method curve is the same as the slope for the direct method curve, as shown in Figure 2, the direct method was employed in this study. In addition, all values reported are based on the factor from aqueous standards, since the addition method gave essentially the same results.
2.4 ProcedurePaper samples were weighed on the Perkin-Elmer AD-2 electronic ultramicrobalance. The solid paper samples were introduced directly into the carbon cup atomizer with tweezers where they were dried, ashed, and atomized for analysis of copper and iron. Since the two methods gave essentially the same results, the direct method was used in modified form. After calculating the slope of the calibration curve, the concentration of each sample could be determined by dividing absorbence of the unknown sample by the calibrated slope. This procedure was used since it was established that the slopes for each element in every sample were identical. This method afforded a quick and exact determination of metal content in paper and eliminated much of sample preparation. 2.5 CalculationThe unknown sample was analyzed from the standard curve, as shown in Figure 2. The metal content was calculated by using Beer's Law. According to Beer's Law,
Calculations of factors from various aqueous standard solutions are shown in Tables II and III. Table IV shows how to use the factors from Tables II and III to determine the iron and copper content in books and library materials. TABLE II CALCULATION OF FACTOR FROM VARIOUS AQUEOUS COPPER STANDARD SOLUTIONS TABLE III CALCULATION OF FACTOR FROM VARIOUS AQUEOUS IRON STANDARD SOLUTIONS TABLE IV THE IRON AND COPPER CONTENT FROM BOOKS AND VARIOUS PAPERS |