The Role of Gelatin in Paper Permanency II
by Timothy Barrett and Cynthia MosierAbstract
Twenty years ago William Barrow's classic study of historical paper specimens led to a much improved understanding of paper permanence. Barrow's work demonstrated that the stability of naturally aged papers is affected by cellulose fiber purity, alum content, amount of alkaline carbonate reserve, and pH. Despite its common use during the history of papermaking, Barrow did not investigate the gelatin sizing content of his papers.
During our recent experiments, 40 historical paper specimens were analyzed for Minolta Chroma Meter L* value, PIXE ppm calcium, surface pH, and gelatin content. The latter analysis was based on a micro scale modification of TAPPI T 504 om-89 "Glue in Paper."
For this study we considered the darkness or lightness of the paper to be an indicator of its present day condition and used Chroma Meter L* readings as relative dark/light values. The data indicate that there may be a positive correlation between higher (lighter) L* values and higher pH, calcium content, and gelatin content. This Kress Foundation funded pilot study work by us continues to suggest gelatin may be an important variable in paper permanence.
Introduction
Modern papermakers and researchers have obtained useful data from the analysis of historical paper specimens. Most notably, William Barrow offered important new standards for permanent and durable machine-made papers following his conclusions that longer lasting historical papers can be characterized by an alkaline pH, cellulose fiber of high purity, non-acidic sizing materials, and an alkaline reserve.
We are interested in gelatin as a component that might also be worthy of attention and the Kress Foundation has supported our preliminary investigations.
From a pool of somewhat more than 500 historical papers made between the 15th and the 18th century, we selected 40 specimens; 20 with a decidedly softer, weaker feel, and 20 with a harder, tougher feel. Each 20 were also selected to represent a range in color from dark to light. All together, the full 40 specimen set was intended to represent a range of apparent paper strength and condition.
All of the 40 specimens were analyzed for Minolta Chroma Meter L* values courtesy Irene Brückle at the Buffalo State College Graduate Program in Conservation. This L* value we interpreted as a relative "dark" to "light" value. Z-direction (or through-the-thickness of the sheet) ultrasonic determinations were made at the Institute of Paper Science and Technology in collaboration with John Waterhouse. Data for PIXE ppm calcium and surface pH had been gathered earlier as reported in Volume 13 of The Paper Conservator.1
Gelatin Analysis Method
Our analyses for gelatin content were the major part of the work reported here. Although we offer a more comprehensive description of our technique in a manuscript currently under review by the AIC Journal, a brief summary of our methods follows.
Gelatin is a protein derived from the larger protein molecule collagen, which is a major constituent of hard and soft connective tissues in animals. When a tissue such as hide or bone is subjected to an alkali or acid pre-treatment followed by extraction in heated water, chemical bonds in collagen are broken somewhat randomly, resulting in the shorter chains of amino acids we call gelatin. (We should point out that this is the present-day method of manufacture and that historically, gelatin was apparently manufactured by extraction in heated water alone). The length of these amino acid chains, which affects many of the properties of gelatin, can vary greatly within one batch, but in general a milder treatment will break fewer bonds and thus yield a larger number of longer molecules than will a more severe treatment. Bonds in collagen and, to an even greater extent, in gelatin are also subject to attack from bacteria and fungi in the presence of moisture.
Despite this variation in gelatin characteristics the amino acid composition of all gelatins is distinguished by its relatively high content of 4-hydroxyproline, an amino acid found in large amounts in no other animal protein. Approximately one out of every eleven amino acids is hydroxyproline. The percent hydroxyproline by weight in mammalian gelatins varies slightly depending on the source of the tissue, the method of manufacture, and the purity of the gelatin; but as an example, a purified calf skin gelatin contains around 14.5% hydroxyproline by weight.
There is an accurate method for determining the protein content of paper, but it is not specific for gelatin. If other proteins or nitrogenous compounds might be present, gelatin content is more accurately determined by measuring the hydroxyproline in the sample and using that value to calculate the amount of gelatin present. The Technical Association of the Pulp and Paper Industry Official Method T-504 revised 1989, is a procedure for the determination of glue or gelatin in paper by determining hydroxyproline.2 We used a modified microscale version of this procedure in our study. Very briefly, using oven-dried paper sample sizes of 5 to 10 milligrams, the gelatin is extracted from the paper, broken into its individual amino acids by acid hydrolysis, treated with activated charcoal to remove interfering compounds (the TAPPI method does not include this step), and evaporated to dryness. Following the addition of alkaline copper sulfate and hydrogen peroxide, the mixture of amino acid residues is heated and any hydroxyproline present is converted to a compound called pyrrole which reacts with p-dimethylamino-benzaldehyde in the presence of acid to form a transient magenta-colored compound which is developed by heating. Following dilution to a known volume, the absorbence of the solution is measured at a wavelength of around 560 nanometers, the concentration of hydroxyproline is calculated based on a standard curve prepared from pure hydroxyproline solutions, and the amount of gelatin present is calculated based on the percent hydroxyproline contained in the most likely type of gelatin to have been used. Based on our recovery of gelatin from paper reference standards we prepared containing known weights of gelatin, our recovery of gelatin from the historic samples is estimated to be 96 + 5%.
Our data do not tell us the source of the gelatin, the methods used in its manufacture, or what impurities, such as fats, for example, were present in the sizing solution. Neither do they tell us anything about the condition or length of the gelatin molecules; that is, whether excessive thermal or microbial degradation occurred either before or after the paper was sized.
They simply give us a quantitative measurement of the amount of hydroxyproline present in the papers, from which we have calculated the gelatin content.
We have found no evidence in the literature or from our own observations that the amount of hydroxyproline measured in the historical specimens is less than the amount originally applied.
Both hydroxyproline and gelatin are moderately stable compounds whose deterioration, under reasonable storage conditions, would become significant only after thousands, not hundreds, of years. Although we cannot know the storage conditions of the historic papers we tested, they did not show signs of damage from water, microbes, or fire. Therefore, we think it quite likely that the amounts of gelatin we have calculated are indicative of the original amounts of gelatin applied to the papers.
Results
Graph I pH versus L* value
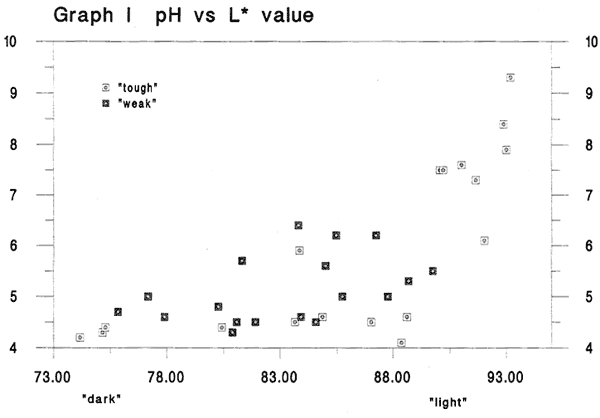
Fig. 1
Before considering the gelatin content in the 40 specimens we'd first like to consider the pH and calcium content of the papers. This graph shows pH on the y-axis and the L* dark/light values on the x-axis. We should mention that we elected to use the darkness or lightness of the paper as our primary indicator of relative condition because of the common inclination to associate lighter colored papers with those in better condition. pH is often assumed to tell us something about a paper s condition or future permanence potential. In this graph we see some evidence of a rise in pH as the historical papers become more light in color. This is a graph that most conservators and paper scientists would anticipate, based on our knowledge of paper permanence or our experience testing the pH of older papers. The tough and weak papers are fairly intermixed, until we get to the very lightest colored sheets where we see a group of tough sheets alone.
We're interested in whether or not pH is a key factor in the papers in the best condition. So, for reference we note that of the 10 lightest specimens in this graph, 7 are also are in the group with the 10 highest pH values. (pH data on one of the 10 lightest is missing). (Although not shown here, a best-fit straight line through all data points gives an rsquared value of .503).3
Graph II Calcium versus L* value
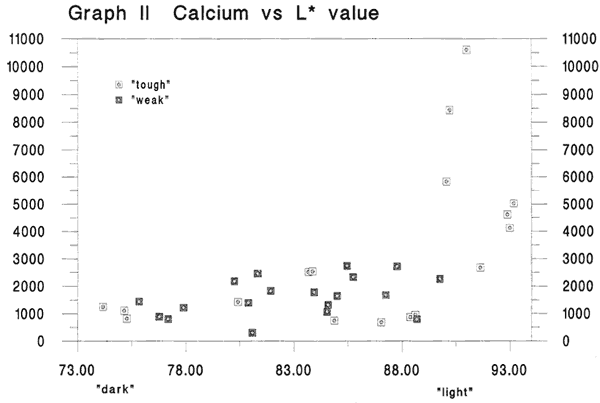
Fig. 2
In this graph, again the lightest colored sheets are associated with a cluster of points indicating the highest values for calcium. This too, is a graph we might have anticipated, although the rising trend from dark to light for the other data is only slight. (Best fit straight line through this graph has an rsquared value of .307). Again, to get a feel for whether or not calcium is a key component in the papers in the best condition, the data tells us that of the 10 lightest specimens shown here, 6 also are in the group with the 10 highest levels of calcium. (Unfortunately data on calcium for 2 of the the 10 lightest are lacking).
Graph III Gelatin versus L* value
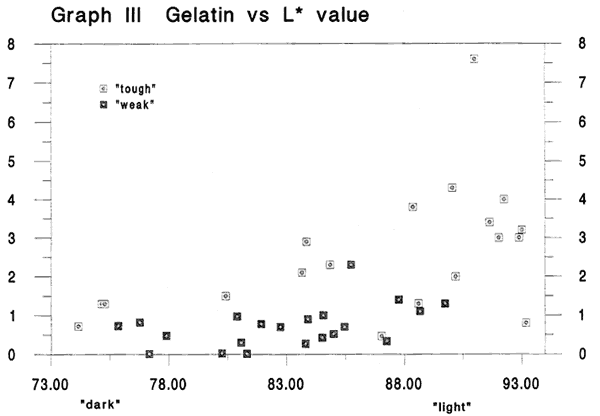
Fig. 3
This graph shows weight percent gelatin content versus dark/light values. A similar cluster of top performers is seen at the high end of the scale. We also notice that points for the papers we thought felt weak, tend to lie lower than those for the tough papers. The data are scattered but we feel a trend is apparent and that it may indicate a positive correlation between increased gelatin content and lighter paper color. Of the 10 lightest specimens in this graph, 6 are also in the group with the 10 highest gelatin levels.
Other than 1943 National Bureau of Standards tests in which ten writing papers from the seventeenth and eighteenth centuries were found to contain between 2.6 and 5.8 percent gelatin, to the best of our knowledge, this is the first time quantitative data on gelatin in a range of historical paper specimens has been gathered.4 (Rsquared value the best fit straight line through this graph is .308).
To pull these three graphs together, and to attempt a composite characterization of the papers in the best condition: We would note the following- of the 10 lightest specimens, 6 share top ten values for pH and calcium, 5 share top ten values for pH and gelatin, and 4 share top ten values for all three: pH, calcium, and gelatin. It is important to restate that for the ten lightest sheets, we are unfortunately lacking one pH data point and two for calcium. Nevertheless, we feel the graphs indicate that in addition to pH and calcium content, gelatin content is indeed a variable in these papers and possibly an important one. After additional work to demonstrate that gelatin really does occur at higher levels in best present day condition historical samples, accelerated aging studies will be necessary to fully understand the interrelationship between gelatin and the other components in paper and their respective contributions to paper permanence.
Graph IV Gelatin versus ultrasonic
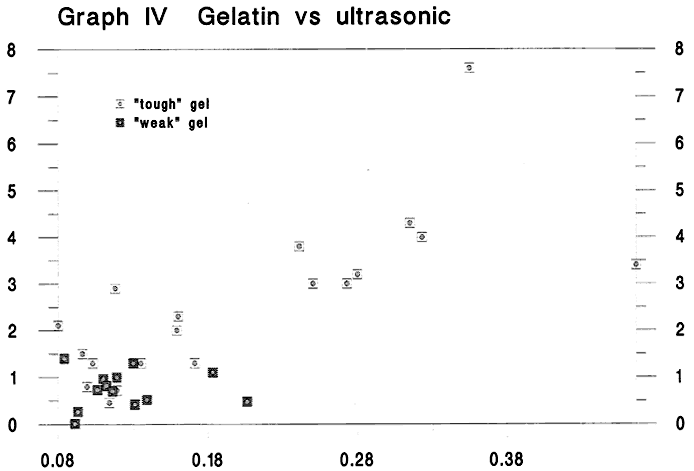
Fig. 4
Finally, we would like to show you this graph, where we have plotted gelatin content versus z-direction (or through the thickness of the sheet) ultrasonic properties. Ultrasonic methods are routinely used today in the paper industry to estimate the strength of paper non-destructively. We still don't know if the method will work with historical papers, but we re continuing experiments to investigate it s potential. What we do know, and this graph demonstrates it, is that increases in gelatin content are associated with increases in ultrasonic values. (A straight line through this graph gives a relatively good rsquared value of .636). Thus the ultrasonic method may prove to be the most promising technique for estimating gelatin levels in historical papers non-destructively. We note once again, the cluster of tough papers at the high end of the scale.
Conclusions
1) In the group of 40 historical paper specimens tested, independent graphs for each property indicated the lightest colored sheets are generally associated with higher values for pH, calcium content and gelatin content.
2) Papers that have survived long term natural aging are a valuable source of data for consideration during research on paper permanence. Gelatin deserves additional research attention as a component in the chemical and physical systems of papers made in Europe between 1400 and 1800.
3) Ultrasonic methods deserve additional attention as a possible means of estimating gelatin levels and/or strength in historical papers.
Acknowledgments
Our thanks to the Grinnell College Chemistry Department and in particular Dr. Jim Swartz for access to laboratory facilities where Cynthea Mosier executed the 700 hydroxyproline determinations required in this study. Special thanks to Irene Brückle for making all of the required Minolta Chromameter L* determinations. Our thanks as well to Dr. John Waterhouse at the Institute of Paper Science and Technology for his expert advice during ultrasonic analyses.
Finally, the Samuel H. Kress Foundation provided the major portion of funds required for this project.
Postscript
The experiments described here are a portion of pilot work leading to a larger, ongoing study of the role of gelatin in paper permanence. The first part of this research will analyze a wide range of historical papers for gelatin content and other properties using non-destructive methods. Pending results of Part I, Part II will employ temperature and humidity cycling and pollutant gas accelerated aging to investigate the role of gelatin in paper permanence.
Notes
1. T. Barrett, The Paper Conservator, Volume 13, 1989, London.
2. Technical Association of the Pulp and Paper Industry, "Glue in paper (qualitative and quantitative determination) T 504 om-89," TAPPI Test Methods 1991, TAPPI Press, Technology Park/Atlanta, P.O. Box 105113, Atlanta, Georgia 30348.
3. Specifically, this number is the error rate for the equation of the best fit straight line generated by Computer Associates CA-Cricket Graph software. According to the software documentation, The rsquared value signifies the coefficient of determination of the data. This coefficient indicates the relative accuracy of the curve [or line] formula, where a value of 1 indicates complete or near complete accuracy. A correlation of 0.93, for example, indicates a more accurate formula than one of 0.82.
4. W. J. Barrow, Manuscripts and Documents--Their Deterioration and Restoration, Charlottesville, The University Press of Virginia, 1955. p35. In this publication, Barrow cites 1943 National Bureau of Standards tests in which ten writing papers from the seventeenth and eighteenth centuries were shown to contain between 2.6 and 5.8 percent gelatin.
Timothy BarrettUniversity of Iowa Center for the Book
Cynthea Mosier
University of Iowa Libraries
Publication History
Received: Fall 1994
Paper delivered at the Book and Paper specialty group session, AIC 22nd Annual Meeting, June 11, 1994, [PLACE].
Papers for the specialty group session are selected by committee, based on abstracts and there has been no further peer review. Papers are received by the compiler in the Fall following the meeting and the author is welcome to make revisions, minor or major.