Evaluation of the State of Degradation of Dead Sea Scroll Samples Using FT-IR Spectroscopy
by Michele DerrickNote : numbers into () refer to the bibliography.
Abstract
The surface and interior of samples from the Dead Sea Scrolls were examined using an FT-IR and micro FT-IR to obtain information on the state of deterioration of the samples. In addition, this method provided information on non-proteinaceous materials in the samples that may have been added in the processing of the parchment. Detailed examination of the amide I and amide II absorbance band intensities and positions showed that collagen modification along with hydrolysis and oxidation had occurred in the samples. Non-proteinaceous materials identified in the samples were carbonates, silicates and alum. Micro-infrared analysis provided information on the sample cross-sections and the differences between the surface and the interior of the samples.
Introduction and Background
In 1988, the Getty Conservation Institute began a evaluation of the optimum storage and display conditions for the Dead Sea scrolls. After it was determined that controlling the environment is critical to the stabilization of severely degraded parchment samples (l) several analytical methods were used by GCI to evaluate the state of degradation of scroll fragments. These included X-ray diffraction, liquid chromatography and infrared spectroscopy.
Visually the scrolls exhibited a wide variation in states of degradation. The condition of the fragments removed for analysis ranged from 'poor' (fragile, brittle, dark-colored areas) to good
(strong, intact, light-colored areas). Since initial infrared analysis survey indicated that the surface composition of the dark and light areas were chemically different, further work was carried out to elucidate information on the spectral differences and to obtain additional spectral analysis of a cross-section of each sample using infrared micro spectrometry. The focus of this study was to use infrared spectroscopy to determine the state of deterioration of the samples and to locate and identify any non-proteinaceous materials in the samples.
Background
The collective group of documents known as the Dead Sea scrolls were written on parchment, papyrus and copper scrolls. The parchment scrolls were prepared from the skin of sheep and goats about 2000 years ago (2). The actual dates of preparation, 200 B.C.E (before current era)-100 C.E (current era), were confirmed by 14C analysis at GCI (3) and in Zurich (4).
Ancient preparation techniques for parchment involved abrasively dehairing the skin and/or using a vegetable matter, enzymatic dehairing bath. These baths often contained plant and vegetable matter mixed with animal fats, eggs, milk, wine, vinegar, urine and dung. Often minerals, such as alum (aluminum ammonium sulfate) and salt (sodium chloride) were added to the fermenting liquor or applied directly on the skins after removal from the baths. These minerals may have aided in the drying process. After removal from the baths, the skins were stretched tightly on a frame. While on the stretcher, the water was removed from the skins by scraping with a half-moon knife. After drying the skins were smoothed by abrasion, usually with pumice stones.
The Palestinian Jews uniquely finished the parchment surface with small amounts of vegetable tannage or cedar oil (5). Reed (6) showed by microscopic evaluation that when tannage agents are present, they are restricted to the outer grain and flesh layers. He identified garlic and ellagic acid in each by chromatographic analysis of the samples. These are constituents of vegetable tannins obtained from nutgalls, tree bark and other plant parts and, when combined, are commonly referred to as tannic acid.
Parchment degradation
Collagen is the primary component in parchment. Most of the putrefactive materials in animal skin (fats, blood, water, etc.) were removed during the parchment preparation leaving aligned collagen fibrils with interstitial mucopolysaccharides, glycol proteins and plasma proteins.
There are three major degradation paths for collagen: denaturation, hydrolysis and oxidation (7). All are irreversible. In denaturation, the collagen breakdowns to form gelatin. This occurs when the tropocollagen molecule, held in a triple helical structure via hydrogen bonds, becomes structurally disorganized or gelatinized due to the addition of heat or water (8). Gelatin is an aqueous colloidal suspension of polypeptide chains and fragments of chains. Hydrolysis is pH and humidity dependent and results in the breakage of the peptide linkages forming amino acid end groups. Oxidation of the peptide chain results in subsequent cross-linking and/or chain breakage depending on the position of the attack.
A literature survey showed that the degree degradation of parchment can be assessed by several methods, such as determining the collagen/gelatin ratio using IR (9, 10) and XRD (7), or measuring the water content (11), sulfur content (12) or shrinkage temperature (13) as well as examining the racemization of D and L aspartic acid (7).
Experimental
Samples
Nine Dead Sea scroll parchment samples were analyzed in two batches. Table 1 lists the samples and the type of analysis done. The samples consisted of small fragments removed from known scrolls. Additionally three types of modern parchment were analyzed as references. The samples were non-homogenous and varied significantly from point to point. Areas on the pieces ranged in color from a very dark brown to a light beige. The black, degraded areas were found to be soluble in water and have been described as "the ultimate decomposition product of the animal membrane, in other words, a form of glue" (14).
Infrared Analysis - Surfaces
The surfaces of the samples were analyzed using an Attenuated Total Reflectance (ATR) attachment on a BioRad 15-E Fourier transform infrared (FT-IR) spectrophotometer. The FT-IR is purged with dry, CO2-free air and is equipped with a cryogenically-cooled, wide range Mercury-Cadmium-Telluride (MCT) detector and a Motorola 3280 computer. All spectra are the sum of 200 scans collected at a resolution of 4 cm-l over the range of 4000-550 cm-1.
For each analysis, a small piece of the sample was placed in contact with a KRS-5 crystal in the ATR cell. All samples were analyzed with an incident beam of 55 degrees which results in a beam penetration depth of approximately 20 μm. Analyses were done on the front (skin side) and the back (flesh side) of each piece, the dark and light areas as well as the interior of one piece. Both sides gave similar results and the reported results in the paper are primarily from the front side of each piece (listed in Table 1).
Infrared Analysis - Cross-sections
The cross-sections were analyzed by infrared mapping micro spectrometry using a Spectra Tech IR Plan II microscope in a Perkin-Elmer 1760 FT-IR interfaced to a P-E Model 7700 data station. A cryogenically-cooled, narrow range MCT detector was used to collect 120 scans at 4 cm-1 resolution over a range of 4000-700 cm-1.
| SAMPLE | BAND POSITIONS | INTENSITY RATIO | DIFFERENCE IN cm-1 | |
| 1650 | 1550 | |||
| Khirbit Hird 3;front | 1635 | 1539 | 1.4 | 96 |
| Khirbit Hird 4:front | 1635 | 1540 | 1.3 | 95 |
| Khirbit Hird 5;front | 1635 | 1541 | 1.4 | 94 |
| Cave IV, 9A1; back | 1635 | 1539 | 1.3 | 96 |
| Cave IV, 9A3; front | 1652 | 1538 | 1.6 | 114 |
| Thanksgiving B-2;frt | 1635 | 1541 | 1.4 | 96 |
| Isaiah (B); front | 1635 | 1540 | 1.4 | 95 |
| Temple (B): front | 1646 | 1537 | 1.6 | 109 |
| Genesis (C): front | 1640 | 1538 | 1.4 | 102 |
| Italiano(Ref):back | 1629 | 1541 | 1.1 | 88 |
| Stabilise (Ref) ;front | 1635 | 1544 | 1.0 | 91 |
| Sheep (Ref): front | 1631 | 1540 | 1.1 | 90 |
| SAMPLE | CARBONATE (Chalk) | SILICATES (Pumice, talc, dirt) | ALUM |
| Khirb.Hird 3: front | VS (0.1) | M (1.1) | S (0.2) |
| Khirb.Hird 4: front | VS (0.1) | M (1.1) | S (0.2) |
| Khirb.Hird 5: front | S (0.2) | M (1.3) | S (0.3) |
| Cave IV, 9A1: front | L (1.2) | L (2.6) | nd |
| Cave IV, 9A3: front | L (1.6) | L (2.8) | nd |
| Thanks. B-2: front | nd | S (0.7) | nd |
| Isaiah (B): front | nd | M (1.0) | nd |
| Temple (B): front | VS (0.1) | M (1.7) | M (0.7) |
| Genesis (C): front | nd | M (1.2) | nd |
| Italiano(Ref):front | VL (2.7) | nd | nd |
| Stabilise(Ref)front | S (0.2) | S (0.5) | nd |
| Sheep (Ref): front | VS (0.1) | S (0.6) | nd |
Bands used:
protein=1650 -1
chalk=870 -1
talc=1000 -1
alum=600 -1
Small pieces (5 mm x 1 mm) from each fragment were removed, embedded in a polyester/styrene media, then microtomed to obtain 10 μm thick cross-section slices. The slices were placed on a BaF2 window in the microscope for analysis by infrared transmitted light. Spectra were collected using an aperture of 40 x 400 μm selected using variable knife edge apertures at two focal points above and below the sample compartment. The window was then stepped across the width of the sample in 40 μm increments using a motorized mapping stage. This is referred to as a spectral map of the sample. A microphotograph was later taken, in normal and polarized light, for visual comparison of the spectra analysis.
Results
Analysis of Dead Sea Scroll Samples
The samples were non-homogeneous, and the spectral results varied from area to area within a piece. Thus, while the results themselves are reproducible (determined by replicate analysis) and are characteristic of the area analyzed, they may not be representative of the entire scroll from which the piece came. This is particularly true since the samples were taken from the outer edges of the scrolls and the outer edges are more degraded that the interior portions (7). However, since several samples were analyzed which cover a wide range of types, the total set of infrared results on these pieces are probably exemplary of many areas on the scrolls.
All of the infrared spectra for outer surface of the fragments contained bands corresponding to proteinaceous and nonproteinaceous materials. The proteinaceous bands were examined for indications of collagen denaturation, hydrolysis and/or oxidation and the bands due to non-proteinaceous materials, were measured in proportion to the amide I bands in order to determine their relative concentrations.
Infrared Analysis of Collagen and Gelatin
A representative infrared spectrum for protein is shown in Figure 1, plotted from 2000 to 700 cm-1. This figure contains an infrared spectrum for a parchment reference sample as well as a spectrum from a scroll fragment. Protein spectra are characterized by the following amide stretching and bending vibrations:
| Amide A | 3300 cm-1 | NH stretching |
| Amide B | 3070 cm-1 | NH bending overtone |
| Amide I | 1650 cm-1 | c=0 stretching |
| Amide II | 1550 cm-1 | NH bending, CN stretching |

Figure 1. Exemplary spectra for parchment samples from a modern reference sample and a 2000 year old scroll fragment. Protein is characterized by the Amide I band (1650 cm-1) and the Amide II band (1550 cm-1).
Collagen denaturation to gelatin has been characterized using infrared spectrophotometry by Brodsky-Doyle et al. (9), Susi et al.(10), and Warren et al. (15). These studies indicate that the most noticeable change in the infrared spectra during denaturation in the amide II band shift from 1550 to 1530 cm-1 when the collagen helix is converted to the disordered form found in gelatin. This shift will correspond to an increase in the separation of the amide I and II bands at 1650 and 1550 cm-l. The reproducibility of band positions due to measurement error is +/-3 cm-1. Thus the band position changes of greater than 6 cm-1 are significant.
Hydrolysis of the polypeptide chain may occur in either the collagen or gelatin form. In the infrared spectra, hydrolysis would be apparent as an increase in the OH stretching or bending frequencies found at 3400 and 1650 cm-1, respectively. Since the amide I band also occurs near 1650 cm-1, an increase in the OH band at 1650 would result in an increase in the absorption intensity or height of the amide I band. The can be seen in figure 1 by comparing the relative absorption intensities of the amide I band to that of the amide II. In the spectrum for the reference parchment sample, the two bands are close to the same intensity, while in the Isaiah scroll spectrum, the amide I band is much higher than the amide II.
Oxidation of the polypeptide chain can result in the formation of carbonyl compounds which would absorb in the 1700 -1750 wavenumber region. This can be seen as a slight shoulder on the amide I carbonyl band and may result in the increase in area of the amide I band. This study noted indications of oxidation in many of the samples but did not try to quantify it. Other methods, such as HPLC analysis of the amino acids, may be better for this purpose.
Collagen degradation
Collagen degradation may occur via denaturation, hydrolysis or oxidation. The infrared spectra can be used to examine each of these processes individually. As presented earlier, the denaturation of collagen has been shown to be related to the absorbance band position shifts of the amide I and amide II stretches. Thus, in this study, each of these band positions were listed and the wavenumber difference between the two bands was then calculated for easy comparison of the separation between the two bands. Table 1 lists the values and figure 2 shows a plot of these differences. The reference parchment samples all had a band separation of 91 cm-1 or less. For the scroll samples, the separation was greater than 94 cm-1. For three of the samples, the separation was greater than 100 cm-1.
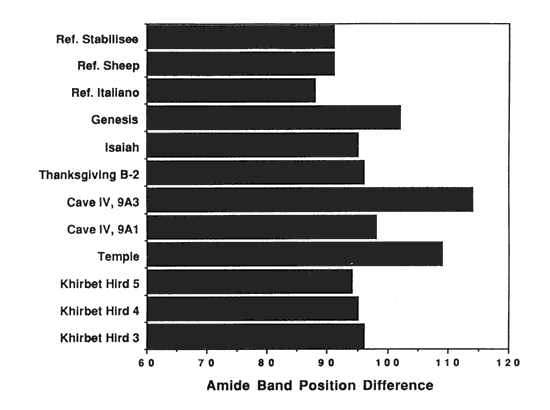
Figure 2. Collagen denaturation in Dead Sea Scroll samples as indicated by the change in position of the Amide I and Amide II bands in the infrared spectra

Figure 3. Protein hydrolysis in Dead Sea Scroll samples as indicated by the change in heights of Amide I and Amide II bands in the infrared spectra
For the examination of protein hydrolysis, the ratio of the amide I and amide II bands are plotted in figure 3. By using the relative ratio of the two bands, any intensity differences between spectra are normalized and are then comparable. The reference parchment samples were found to have a band intensity ratio of 1.0 - 1.1, while the band intensity ratios of the scroll fragments ranged from 1.3 - 1.6. All samples were analyzed in a dry atmosphere so the OH frequencies should be due to bound water rather than absorbed water.
Figure 4 contains the combined results from the plots in figures 2 and 3 for the denaturation and hydrolysis of the samples. This combined plot exemplifies that the samples obtained from the Temple (B) and the Cave IV 9A3 scrolls are the most degraded. The samples obtained from Khirbet Hird set are least degraded. None of the scroll fragments, however, are as good as the reference materials.
The sample which was split open for the analysis of the interior was found to exhibit very few signs of degradation as well as no indication of inorganic materials. Thus, infrared micro spectrometric analysis of the cross-sections were done to determine the depth of penetration of the degradation as well as the presence of other compounds.
Infrared micro spectroscopy showed some interesting trends. Specifically, the cross-section analysis showed that the degradation and inorganic components, found previously on the surface of the pieces, are not prevalent in the interior of the samples. Figure 5 shows an infrared spectral map of the cross section from the Cave IV 9A3 scroll. The variations in the spectra for the exterior and interior portions of the sample are clearly seen. Microphotographs for the same embedded cross-section are shown in photos 1 and 2 in normal and cross polarized light, respectively. Under cross-polarized light, the inorganic compounds in the sample exist only near the edges. However, the inorganic material appears to be embedded in the parchment rather than just as a surface encrustation.
Non-proteinaceous Materials
Bands corresponding to non-proteinaceous materials or additives were found on the surface of all of the scroll samples. None were detected on the interior of the samples. Three compounds, carbonates (CO3=), silicates (pumice, talc or dirt) and alum (aluminum ammonium sulfate), were found as mixtures or individual components in the samples. Figure 6 shows a plot of the relative proportions of these materials found in the samples. The numeric value (found in Table 2), represents the ratio of the peak intensity of the inorganic compound versus the band intensity of the amide I band. This normalizes the variations in intensity between the different spectra. However, the proportions of one material to another, i.e. silicates to carbonates, cannot be compared because the absorptivity of the two materials has not been measured.

Figure 4. Combined plot of changes in the Amide I and Amide II band positions and heights which indicate changes in the collagen due to the denaturation and hydrolysis.

Photo 1. Cross-section photo of sample from a Dead Sea Scroll (Cave IV, 9A3) at 250 x under normal light

Photo 2. Cross-section photo of same sample at 250x using crossed polarizers

Figure 5. Linear map of Dead Sea Scroll cross-section

Figure 6. Relative infrared absorbances for inorganic additives found in samples from the Dead Sea Scrolls.
These three inorganic materials, possibly due to parchment preparation, were readily identifiable by sharp characteristic bands which were not obscured by other absorptions. There could be other compounds present in the samples which were in low concentrations or were obscured by other bands and were not identified such as the garlic and ellagic acid found by Reeds using chromatography.
Alum, used in tawing parchment, was only found in the Khirbet Hird series and in the sample from the Temple scroll. Silicates, possibly pumice from use as an abrasive, was found in all of the exterior surfaces of the scroll pieces (except for the back side of the Thanksgiving scroll). Carbonates, possibly used to fill pores or an abrasive, seemed either to be present in large amounts, as in the samples from Cave IV, or present in very small or non-detectable amounts, as in the remaining scroll samples.
Summary
The surface and interior of the samples were examined using an FT-IR and micro FT-IR to obtain information on the state of deterioration of the samples and the presence of non-proteinaceous materials. Infrared bands corresponding to both proteinaceous and non-proteinaceous materials were found on the surface of each scroll fragment. Detailed examination of the amide I and amide II protein band absorbance intensities and positions showed indications of collagen degradation in the samples. The dark areas of the samples were found to exhibit a higher degree of degradation than the light areas. Of the samples analyzed, the pieces from the Temple scroll and the Cave IV 9A3 scroll were found to be the most degraded.
Non-proteinaceous materials which were identified in the samples were carbonates, silicates and alum. The samples all contained at least one of these; some samples (Khirbet hird) contained all three. The presence and quantity of these materials varied significantly from sample to sample which was not unexpected, since that samples may have been produced by several different groups over a time span of 300 years. Other organic tanning agents may have been present but in amounts too small to detect by infrared spectroscopy.
Infrared mapping micro spectrometry illustrated that the interior of the scroll cross-sections does not exhibit the degradation and inorganic compounds found on the exterior surfaces. It also showed that the characteristics of the samples obtained a few microns apart can vary significantly. Thus, the tiny, individual samples analyzed cannot be considered to represent the entire scroll from which it came. However, this study did provide an overview of the condition and the materials present in several samples, with the understanding that these results are probably typical of many areas on some of the scrolls.
Acknowledgments
The author would like to thank Dr. Frank Preusser and Dr. Bill Ginell for supporting this research project. She would also like to thank Dr. Dusan Stulik, Eric Hansen and Dr. Harry Sobel for their helpful comments and technical assistance. The author also appreciates the helpful assistance of Steve Bouffard and Dr. Jim Landry at Loyola Marymount University and the use of their infrared microscope.
Bibliography
1. E. Hansen; S. Lee: H. Sobel; "The Effects of Atmospheric Moisture on Some Physical Properties of Modern Vellum: Implications for the Optimum Relative Humidity for the Display and Storage of Parchment", 1991 Book and Paper Group Annual, AIC (preceding paper in this book).
2. Ryder, M.L., Nature, 182, pp.781-783 (1958).
3. D.C. Stulik, Internal GCI report, 1990.
4. Bonani, G.; S. Ivy; W. Wolfi; I. Carmi; M. Broshi; J. Strugnell; "Radiocarbon Dating of Some of the Dead Sea Scrolls", Radiocarbon, 33(2), pp.180-181, 1991.
5. Poole, J.B.; Reed, R., "The Preparation of Leather and Parchment by the Dead Sea Scrolls Community," Technology and Culture, Winter (1962), pp. 1-26.
6. Reed, R., The Nature of Making Parchment, (1975).
7. Haines, B.M., "The Structure of Leather and Its Deteriorations," Journal of the Society of Leather Technologists and Chemists.
8. Weiner, S.; Kusanovich, Z.; Gil-Av, E.; Traub, W.; "Dead Sea Scrolls Parchments; Unfolding of the collagen molecules and racemization of aspartic acid", Nature, 28, (1980) pp. 820-823.
9. Brodsky-Doyle, B.; Bendit, E.G.; Blout, E.R., "Infrared Spectroscopy of Collagen and Collagen-Like Polypeptides", Biopolymers, 14, (1975) pp. 937-957.
10. Susi, H.; Ard, J.S.; Carroll, R.J.., "Hydration and Denaturation of Collagen as Observed by Infrared Spectroscopy", J. Am. Leather Chemists Assoc., 66 (11), (1971) pp. 508-519.
11. Petushkova, P.Y.;Nokolaev, G.M., "Nuclear Magnetic Resonance Study of Parchment and Leather", Restaurator, 5, (1983) pp. 242248.
12. Haberditz, A.; Stachelberger, H.; Banik, G.; Bauer, F.; Mairinger, F., "Chemical Characterization of Parchment, Part I, Sulfur Bearing Constituents", ICOM, 7th Triennial Meeting, Copenhagen, Sept. 1984, Preprints, pp. 5-7.
13. Haines, B.M., "Shrinkage Temperature in Collagen Fibres", Leather Conservation News, 3 (2), (1987) pp. 1-5.
14. Plendeleith, H.J., "Technical Note", Discoveries in the Judaen desert, I, ed. Barthelmy and Milk, (1955) pp. 3-39.
15. Warren, J.R.; Smith, W.E.;Tillman, W.J., "Internal Reflectance Spectroscopy and the Determination of the Degree of Denaturation of Insoluble Collagen", J. Am. Leather Chemists Assoc., 64 (1), (1969) pp. 4-11.
Michele DerrickGetty Conservation Institute
Publication History
Received: Fall 1991
Paper delivered at the Book and Paper specialty group session, AIC 19th Annual Meeting, June 3-8, 1991, Albuquerque, New Mexico.
Papers for the specialty group session are selected by committee, based on abstracts and there has been no further peer review. Papers are received by the compiler in the Fall following the meeting and the author is welcome to make revisions, minor or major.