=K x U x S
Journal of Food Science. Vol. 48. 1983. pp. 1395-1399.
Authors Gossett and Baker are affiliated with the Dept. of Poultry & Avian Sciences and Author Rizvi is affiliated with the Dept. of Food Science Cornell Univ. Ithaca NY 14853
Ms received 11/12/82; revised 5/2/83; accepted 5/6/83.
This research was in part supported by an American Egg Board Fellowship to author Gossett.
Apparent viscosities of pH-adjusted or succinylated raw egg albumen were measured at 10, 20, and 30°C using a Haake rotary viscometer. Viscosities decreased with increasing temperature. Rheological power law model parameters indicated that as pH approached 5-6 and 11, albumen became more Newtonian. Control albumen (pH 9.0) and succinylated albumen were pseudoplastic. Intrinsic viscosities of pH 9.0, 10.0, and 11.0 albumens were 0.083, 0.092, and 0.102 dl/g, respectively, and that of succinylated albumens (0, 0.1, 0.2, and 0.4% w/w) were 0.052, 0.147, 0.149, and 0.184 dl/g, respectively. Apparent viscosities of coagulated albumen, measured by capillary extrusion, increased with pH but did not change with succinylation. Yield forces and rigidity moduli of these gels increased with pH but not with succinylation level.
THE SUCCESSFUL DEVELOPMENT of new egg products such as precooked, frozen, and thawed omelets, quiches, or egg burgers have been limited by problems resulting from moisture loss during various heating and freezing processes. Gossett and Baker (1983) found that by adjusting the pH to alkaline values (pH 9.0-11.0) or by succinylating raw egg albumen, the expressible moisture of these egg proteins after coagulation and freezing is reduced. Before using these modified proteins in food products, it is necessary to characterize the rheological behavior of the raw and coagulated albumen for further insight into end-product characteristics.
Although the viscosities of egg albumen and pH-adjusted albumen have been studied (Tung et al., 1981; Pitsilis et al., 1975) the viscosities of high pH albumen or of succinylated albumen have not. The viscosity of the fluid albumen provides information about the flow properties of the bulk fluid but for understanding about the macromolecular changes of albumen occurring at high pH or with succinylation, the intrinsic viscosity should be measured. Also, knowledge of the behavior of coagulated gels is essential for understanding end-product textural properties. Dunkerley and Hayes (1980) and Egelansdal (1980) have both measured the gel strength of egg proteins as a function of pH but not at the very high pH levels. Hickson et al., (1982) have studied rheological properties of heat-coagulated egg albumen. To date, the rheological behavior of succinylated albumen has not been published although Ball and Winn (1979) have studied acylated gels.
The goals of this study were to (1) measure the apparent viscosity of pH-adjusted or succinylated albumen and quantify the rheological behavior by fitting the data to the power law model; (2) measure the intrinsic viscosity of pH-adjusted or succinylated albumen; and (3) measure the apparent viscosity, yield force, and modulus of rigidity of the coagulated pH-adjusted or succinylated albumen gels.
The source of eggs, sample preparation, and estimation of extent of succinylation were as described in Gossett and Baker (1983).
Apparent viscosity. Raw albumen was adjusted from pH 4.0 through 11.0 at unit intervals or succinylated at levels of 0, 0.1, 0.2, 03, and 0.4% (g anhydride/g albumen) (Gossett and Baker, 1983). A Haake Rotating Viscometer equipped with a NV narrow-gapped concentric cylinder spindle and cup was used to measure shear stress. Sample size was 12 ml. Temperature was controlled with a circulating water bath, and maintained at ±0.5°C. Shear stresses were measured within 1 min after equilibration of the scale reading at shear rates from 38.8-3140 sec-1 at 10, 20, and 30°C for each pH level or succinylated treatment. Two readings per treatment were made, and the entire experiment was repeated twice.
Calculation of viscosity parameters were as follows:
=K x U x S
where = apparent viscosity, cp; k=calibration
constant, 0.059 (See next paragraph); U=speed factor; rpm=583.2/U;
s=scale reading (normal scale).
 = A x S
where = shear stress, dynes/cm2;
a=shear stress factor=(K x B)/l00.
 = B/Y
= B/Y
where B rate of shear factor=3140; = shear rate, sec-1.
The NV rotor assembly was calibrated with a glycerol solution (65% w/w) having a viscosity of 25.3 cp at 10°C (Hodgman, 1959). After measuring the shear stresses of the solution at various shear rates at 10°C, the calibration constant K was calculated as follows: k=25.3/(U x S).
Intrinsic viscosity. Albumen was prepared by adjusting the pH to 9.0 or by succinylating at levels of 0, 0.1, 0.2, and 0.4% (g anhydride/g albumen). Frozen samples (-25° C, 24 hr) of these pH-adjusted or succinylated albumen were freeze-dried for 48 hr in a Stokes freeze dryer (plate temperature, 10° C).
Solutions for the pH-adjusted samples were made by dissolving freeze-dried pH 9.0 albumen in pH 9.0, 10.0, or 11.0. 0.025 NaHCO3 buffer + 150 mM KCl to give concentrations of 0.5, 1.0, 2.0, and 4.0 g albumen/dl. Solutions of succinylated samples were made by diluting in 0.05M tris(hydroxymethyl)aminomethane buffer (pH 8.5) to give concentrations of 0.5, 1.0, 2.0, and 4.0g albumen/dl/ Dilutions were prepared in tared 25 ml volumetric flasks, which were also weighed containing the diluted samples. The weights of the diluted samples were used to calculate the density of the solutions.
The intrinsic viscosity measurements were made using a Cannon-Fenske Routine Viscometer (K311), size 50, with calibration constant c=0.00396 at 20°C. The capillary viscometer was kept at 20.0 ± 0.5°C by a circulating water bath. Since the temperature of the sample as well as the bath was critical in this measurement, the temperature of the 10 ml sample inside the viscometer was also measured prior to flow by inserting an unmounted, bare thermocouple (Cole-Parmer 8520-90, time constant=3 sec) and reading the temperature of the sample. The time of flow was recorded by a Lemania stopwatch (0.1 sec).
For each concentration at each pH or level of succinylation, three flow times were measured. The entire experiment was repeated twice.
Fig. 1—Capillary extrusion apparatus for measuring apparent viscosity, yield force, and modulus of rigidity of coagulated gels.
Apparent viscosity. an Instron Universal Testing Machine (Model TM) equipped with a capillary extrusion apparatus (Fig. 1) was used to measure the apparent viscosity, the yield force, and the modulus of rigidity of the coagulated albumen. The capillary extrusion apparatus was made of high grade aluminum alloy at Cornell University.
Samples (75g) were coagulated in one of the jacketed cylinders of the capillary extrusion apparatus. the cylinder was connected to a circulating water bath (80°C, two liters/min), and the internal albumen temperature was measured every 30 sec with a thermocouple (Cole-Parmer, Digi-Sense, Model 8520-50, time constant=5 see). Samples were coagulated with 80°C water and then cooled with 5°C water to an average cook value of 5.75 min. One cook value is the time equivalent to heating at 100°C for 1 min (Gossett, 1983). Albumen at pH 7.0, 8.0, 9.0, 10.0, 10.5, and 11.0 and succinylated albumen at the 0, 0.1, 0.2, and 0.4% (g anhydride/g albumen) levels were coagulated in this manner. the coagulated samples were removed from the cylinder with a spatula and cut into cylinders approximately 2.5 cm in height, which were put into the capillary cell and into the orifice cell. the average temperature of the samples prior to extrusion was maintained at 18 ± 1°C.
Samples were extruded as follows: the piston, suspended from the CCT load cell of the Instron Universal Testing Machine, was manually lowered into the capillary cell until the end of the piston was approximately 1.5 cm above the sample. Then the piston was lowered at a crosshead speed of 0.508 cm/mm (0.2 in/min). Extrusion was completed when a constant force value was obtained. the average temperature of the extruded samples was 20° C'
Fig. 2—Typical curves from capillary extrusion experiments: Fy = yield force required prior to extrusion; Fc = force required to extrude gel through capillary cell; Fo = force required to extrude gel through orifice cell; Ly length gel is deformed at yield point.
The same procedure was performed for the extrusion of the sample through the orifice cell. Subtraction of the force required to extrude the albumen through the orifice from that required to extrude the albumen through the capillary cell allowed for correction of the pressure drop due to end effects. a typical force-distance curve is shown in Fig. 2, where Fy is the yield force required prior to extrusion; Fc and Fo are the forces required to extrude the gel through the capillary and orifice cells, respectively; and Ly is the distance the gel is deformed at the yield point.
Three samples were extruded at each pH level or succinylation level for both capillary and orifice attachments.
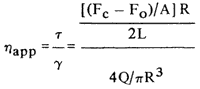
The apparent viscosity was calculated in poises according to Mayfield et al. (1978):
where Fc = force to extrude through capillary; Fo = force to extrude through orifice; a=11.95 cm2; r=0.15 cm; l=3.3 cm; q=0.101 cm3/sec.
Yield force. the yield force was obtained from the force-distance curves of the capillary extrusion. the yield force, Fy, shown in Fig. 2 just as extrusion began, was taken to be the force in dynes required to initiate flow.
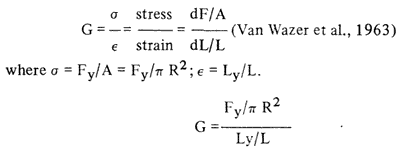
Apparent modulus of rigidity. The apparent rigidity modulus was obtained from the force-distance curves from the capillary extrusion studies. the distance, Ly, that the gel compressed in the capillary cell before extrusion occurred was noted (Fig. 2). Calculation of the modulus was as follows:
where R 1.95 cm=radius of gel; l=2.5 cm=height of gel; Fy = yield force; Ly = length deformed before extrusion.
For each treatment, a one-way analysis of variance was computed for a completely random design. When a significant F ratio was obtained as a result of the analysis of variance, a protected least significant difference (LSD) test was performed at the 5% level of significance (Snedecor and Cochran, 1976).
Fig. 3—Apparent viscosity versus log shear rate for raw pH-adjusted albumen at 20°C.
Fig. 4—Apparent viscosity versus log shear rate for raw succinylated albumen at 20° C.
Apparent viscosity. The shear stresses for pH-adjusted and succinylated albumen were calculated for various shear rates at 10, 20, and 30°C, and the corresponding apparent viscosity was calculated for each sample.
The albumen appeared to be pseudoplastic, except for the pH 5.0—6.0 and 11.0 treatments which appeared to be Newtonian (Fig. 3). in general, the apparent viscosities of pH 4.0-8.0, 10.0 and 11.0 samples at comparable shear rates appeared to be less than that of pH 9.0 albumen. Succinylated albumen at 20°C appeared to be pseudoplastic and, at comparable shear rates, the apparent viscosity decreased as the level of succinylation increased (Fig. 4). the apparent viscosities of all treatments tended to decrease with increasing temperatures.
a Triplicate determinations; average standard deviation for kpH = 0.047; for npH = 0.13; for ksucc = O.141 for=0.12.
To quantify the non-Newtonian behavior of the pH-adjusted and succinylated albumen, the data were fitted to a power law model. for each treatment-temperature combination, the shear stress was plotted against shear rate to determine if a yield stress existed. for both pH and succinylation treatments, no apparent yield stresses were apparent; that is, the plots of shear stress versus shear rate gave straight lines through or near the origin. Linear regression of plots of ln (shear stress) versus ln (shear rate) yielded the values k from the intercept and n from the slope (average r2 = 0.99). the n and k values are shown in Table 1 for 10, 20, and 30°C.
The n value for the control albumen (pH 9.0) was less than 1.0 (e.g. 0.83 at 20°C), implying pseudoplasticity. At or about pH 6.0 and 11.0, the n value approached 1.0 at all three temperatures and Newtonian behavior was indicated. the k values decreased at about pH 6.0 and 11.0, implying less viscosity at these pH levels.
Pitsalis et al. (1975) found that at pH 5.0—6.0, the viscosity of egg albumen decreased to about 3 cp at 36.7 sec-1 shear rate at 18°C, increased to over 6 cp at pH 9.0, and then decreased to less than 5 cp at pH 10.0. Our results agreed with those observations. Perhaps at pH 5.0-6.0, lower viscosities were observed because the isoelectric points of ovalbumin, ovotransferrin, ovomucin, and ovoinhibitor were approached and some of the protein precipitated out of solution, leaving a less viscous medium that approached Newtonian-like behavior. At pH 11.0 the isoelectric point of lysozyme was approached and perhaps the lysozyme-ovomucin complex was dissociated at these pH levels, leaving the albumen less viscous and more Newtonian-like.
The lysozyme-ovomucin complex contributes to the viscous nature of albumen and at higher pH levels, the complex is dissociated, causing thinning of the albumen (Osuga and Feeney, 1977). At pH 11.0, the proteins might be partially denatured, resulting in a loss of solubility and a decrease in viscosity.
The n value increased slightly with the level of succinylation while the k value decreased slightly, implying that albumen became less viscous and more Newtonian-like with succinylation (Table 1). However, the standard deviations of k and n for the succinylated samples were large enough to prevent a claim of any differences among the succinylated samples.
From the preceding viscosity measurements, changes in flow characteristics of the bulk fluid are obtained. However to gain insight on the macromolecular level, the intrinsic viscosity should be measured.
Fig. 5—Reduced viscosity versus concentration plots for pH-adjusted albumen. intercept=intrinsic viscosity; pH 9.0, 10.0, and 11.0 0.025M NaHCO3 buffer + 150 mM KCl.
a 3 replicates/treatment
Intrinsic viscosity. the kinematic viscosities of pH 9.0, 10.0,, and 11.0 albumen were measured because at these pH values: (1) there were differences in the amount of expressed moisture from the coagulated albumen; (2) the proteins might expand or unfold under these conditions; and (3) the proteins in dilute solution did not precipitate out. The kinematic viscosity multiplied by the density of the dilute solution gave the viscosity of the solution, which was used to calculate the reduced viscosity. From plots of the reduced viscosity versus the concentration of the solutions, the intrinsic viscosity was noted at the intercepts after linear regression of the data (Tanford. 1961; Fig 5 and Table 2).
Fig. 6—Reduced viscosity versus concentration plots for succinylated albumen. intercept=intrinsic viscosity; 0.5M tris(hydroxymethyl) aminomethane buffer, pH 8.5.
The kinematic viscosities of succinylated samples (0, 0.1, 0.2, and 0.4% g anhydride/g albumen) were measured and used to calculate reduced and intrinsic viscosities (Fig. 6 and Table 2). Concentrations of the solutions were calculated on the basis of g/dl where the weight of the succinylated albumen included the weight of the succinic anhydride added.
The intrinsic viscosity for pH 9.0 albumen was less than that for pH 10.0 which was less than that for pH 11 .0 (Fig. 5). the data agreed with the hypothesis that increased net negative charges on the proteins might cause increased repulsion among the protein side groups and cause a general increase in volume or change in shape. From intrinsic viscosity values alone, it was not possible to tell whether the increase was due solely to increased hydrodynamic volume of the protein molecules or to increased axial ratio of the molecules from a change in shape (Scheraga, 1961).
The intrinsic viscosity of the succinylated samples increased compared to the control nonsuccinylated sample, and they also increased as the level of succinylation increased (Fig. 6). These increases might be due to changes in the net negative charge associated with the protein side groups causing a general expansion or a change in shape (e.g. elongation) from repulsive forces. Another explanation would be the incorporation of succinyl groups.
a coagulated with 80°C water; triplicate
determinations
bced Means in the same column within a treatment with
different superscripts are significantly at p=0.05.
Apparent viscosity. For pH-adjusted albumen, the apparent viscosities increased with increasing pH, with the pH 10.5 and 11 .0 gels being significantly higher (P < 0.05) than the pH 9.0 control gel (Table 3). Succinylation had little effect on the apparent viscosities of the gels.
Yield force. For pH-adjusted albumen, the yield force increased with pH, with the pH 10.5 and 11.0 treatments being significantly higher (P <0.05) than the pH 9.0 control gel (Table 3). the yield force required to initiate flow of the succinylated gels did not change with increasing levels of succinylation.
Apparent rigidity modulus. The apparent rigidity modulus was taken to be a measure of deformation characteristics of the gels rather than stress-relaxation qualities. for pH-adjusted albumen, the modulus of rigidity generally increased with pH; pH 10.0 and 10.5 treatments were significantly higher (P < 0.05) than the pH 9.0 control treatment (Table 3). the rigidity modulus did not change with succinylation.
The results indicated that high pH gels were more viscous, required a higher yield force, and were more rigid than pH 9.0 control gels. on the other hand, the succinylated gels did not appear to be different from the control gel in viscosity, yield force, or rigidity.
THE APPARENT VISCOSITIES of raw pH-adjusted albumen and succinylated albumen decreased with increasing shear rates, implying pseudoplasticity. for pH 5.0-6.0 and 11.0 .treatments, however, the albumen exhibited Newtonian behavior. the apparent viscosities generally decreased with increasing temperatures.
The intrinsic viscosities of pH 9.0, 10.0, and 11.0 albumen were 0.083, 0.092, and 0.102 dl/g, respectively, while that of succinylated (pH 8.5) albumen at the 0, 0.1, 0.2, and 0.4% (g anhydride/g albumen) levels were 0.052, 0.147, 0.149, and 0.184 dl/g, respectively. the increased intrinsic viscosities with increasing pH or succinylation implied that the proteins may have increased in volume or changed shape.
For coagulated pH-adjusted gels, the apparent viscosity, the yield force, and the apparent rigidity modulus increased for the higher pH treatments. These same rheological quantities did not appear to change with level of succinylation.
Ball, H.R. and Winn, S.E. 1979. Functional properties of chemically modified egg white. Poultry Sci. 58: 1034.
Dunkerley, J.A. and Hayes, J.F. 1980. Characterization of whey protein gels using a temperature gradient block. New Zealand J. Dairy Sci. & Technol. 15: 191.
Egelansdal, B. 1980. Heat-induced gelling in solutions of ovalbumin. J. Food Sci. 45: 570.
Gossett, P.W. 1983. Some physical and rheological properties of raw and coagulated pH-adjusted or succinylated egg albumen with respect to water retention properties. Ph.D. thesis, Cornell University, Ithaca, NY.
Gossett, P.W. and Baker, R.C. 1983. the effect of pH and of succinylation on the water retention properties of coagulated, frozen and thawed egg albumen. J. Food Sci. 48(5): 1391.
Hickson, D.W., Dill, C.W., Morgan, R.G., Sweat, V.E., Suter, D.A., and Carpenter, Z.L. 1982. Rheological properties of two heat-induced protein gels. J. Food Sci 47: 783.
Hodgman, C.D. ed. 1959. "CRC Handbook of Chemistry and Physics," 40th ed., p. 2169. CRC Publishing Co., Cleveland, OH.
Mayfield, T.L., Hale, K.K. Jr., Rao, V.N.M.. and Angulo-Chacon, I.A. 1978. Effects of levels of fat and protein on the stability and viscosity of emulsions prepared from mechanically deboned poultry meat. J. Food Sci. 43: 197.
Osuga, DT. and Feeney, R.E. 1977. Egg proteins. in "Food Proteins," Whitaker, J.R. and Tannenbaum, S.R. p. 209. AVI Publishing Co., Inc. Westport, CT.
Pistilis, J.G., Walton, H.V., and Cotterill, O.J. 1975. The apparent viscosity of egg white at various temperatures and pH levels. Trans. ASAE.18: 347.
Scheraga, H.A. 1961. "Protein Structure," p. 1. Academic Press, New York.
Snedecor, G.W. and Cochran, W.G. 1976. "Statistical Methods," 6th ed., p. 272. Iowa State University Press, Ames, IA.
Tanford, C. 1961. "Physical Chemistry of Macromolecules," p. 333. John Wiley & Sons, Inc., New York.
Tung, M.A., Watson, E.L., and Richards, J.F. 1971. Rheology of egg albumen. Trans. ASAE 14: 17.
Van Wazer, J.R., Lyons, J.W., Kim, K.Y., and Colwell, R.E. 1963. "Viscosity and Flow Measurement," p. 1. Interscience Publishers, New York.